


 73 / 138

69
GROUNDNUTS
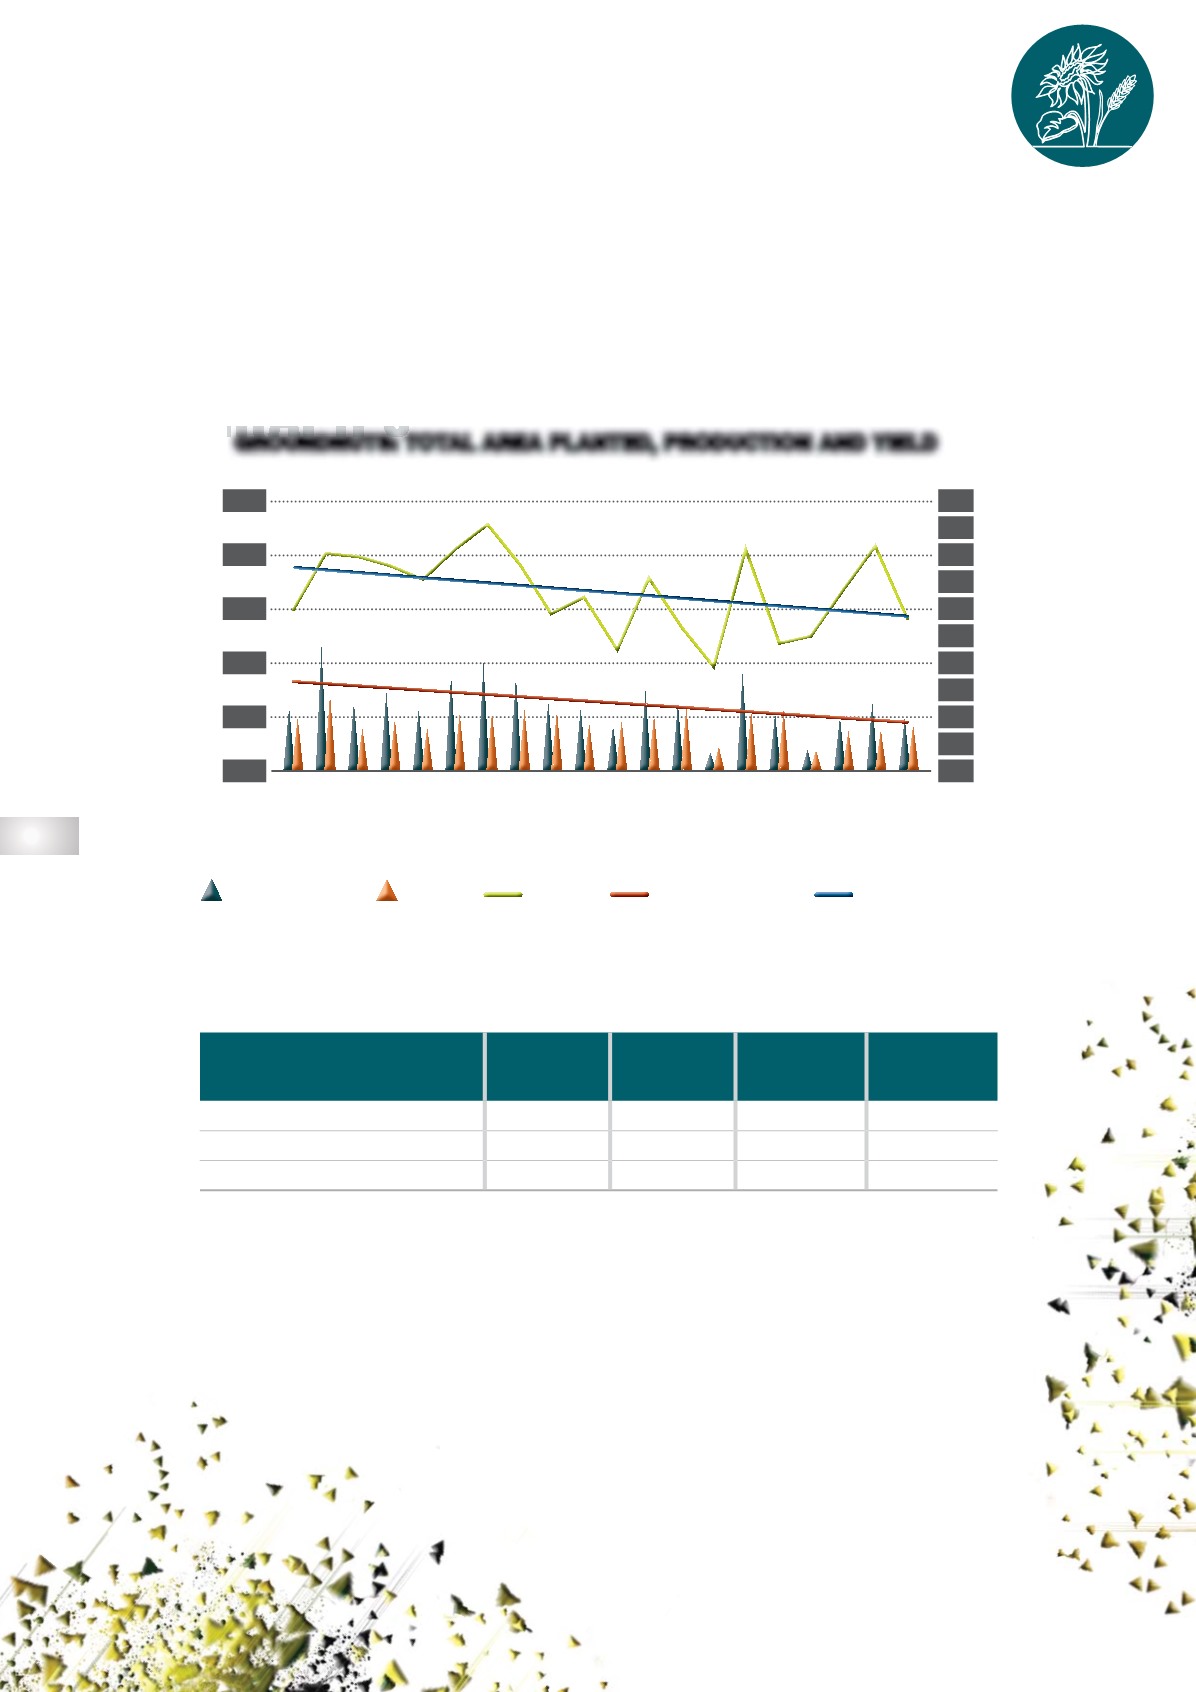
Graph 6
shows the area planted, production and the average yield for groundnuts in South Africa
since the 2002/2003 season. Groundnuts had a difficult season because of unfavourable growing
conditions. The yield for the 2021/2022 season reached a three-year low and declined by 32% from
1,67 t/ha in the 2020/2021 season to 1,13 t/ha in the 2021/2022 season. The total area of groundnuts
planted in 2021/2022 improved because of the bigger yields in the previous season and ensured an
increase of 13% to 43 400 ha. Production dropped by 24% from 64 300 tons to 49 000 tons.
Table 6
contains the production overview for groundnuts in the 2021/2022 season.
GRAPH 6
GROUNDNUTS: TOTAL AREA PLANTED, PRODUCTION AND YIELD
TABLE 6
PRODUCTION OVERVIEW FOR GROUNDNUTS (2021/2022)
2020/2021 2021/2022
5-YEAR
AVERAGE
10-YEAR
AVERAGE
Total planted (hectares)
38 550
43 400
41 680
43 348
Total produced (tons)
64 300
49 00
56 566
54 450
Average yield (tons/ha)
1,67
1,13
1,33
1,22
2002/2003
2003/2004
2004/2005
2005/2006
2006/2007
2007/2008
2008/2009
2009/2010
2010/2011
2011/2012
2012/2013
2013/2014
2014/2015
2015/2016
2016/2017
2017/2018
2018/2019
2019/2020
2020/2021
2021/2022
250
200
150
100
50
0
2
1,8
1,6
1,4
1,2
1
0,8
0,6
0,4
0,2
0
PRODUCTION
AREA
YIELD
Thousand ha or ton
t/ha
LINEAR (YIELD)
LINEAR (AREA)
MARKET OVERVIEW FOR THE
2021/2022 PRODUCTION SEASON