


 80 / 138

76
THE FERTILISER INDUSTRY
South Africa imports more than 80% of its fertiliser needs, therefore local and international prices are
expected to follow a similar trend. Local fertiliser price movements are mainly influenced by international
fertiliser prices and the value of the rand. The fertiliser market experienced a lot of pressure over the
past two years. The Russian invasion of Ukraine in March 2022 influenced the international market, as
Russian fertilisers did not find their way around the world. Russia is the second largest producer of
ammonia, urea, and potash and the fifth largest producer of processed phosphates. In terms of their
share of the global export market, Russia accounts for 23% of ammonia, 14% of urea, and 21% of
potash, as well as 10% of processed phosphate exports. Russia further supplies approximately one-third
of Europe’s natural gas, the main feedstock to produce nitrogen fertilisers. Because of Russia’s
large fertiliser production and its role as a global fertiliser supplier, the removal of Russian products
from the global marketplace has had an enormous impact on the international supply and prices.
The Chinese government also imposed a ban on fertiliser exports, which further caused uncertainty
in the international fertiliser market. Due to the above-mentioned, international fertiliser prices
increased significantly over the past year and local fertiliser prices followed a similar trend.
Fertiliser prices
From September 2021 to September 2022 international prices of fertiliser increased significantly with
double digits – between 16% and 64%.
Table 1
shows the year-on-year changes of international
fertiliser prices in dollar terms.
During the period under review, the exchange rate weakened by 20,3%. Fertiliser prices in rand terms
followed a similar trend to that of the dollar pricing, but the effect of a depreciation in the rand from
R14,59/$ in September 2021 to R17,55/$ in September 2022 caused further increases in rand value.
Table 2
indicates international fertiliser prices in rand terms, with the effect of the weaker exchange rate
on prices.
Graph 3
(on page 78) also indicates the sharp increase in international fertiliser prices for
the past year.
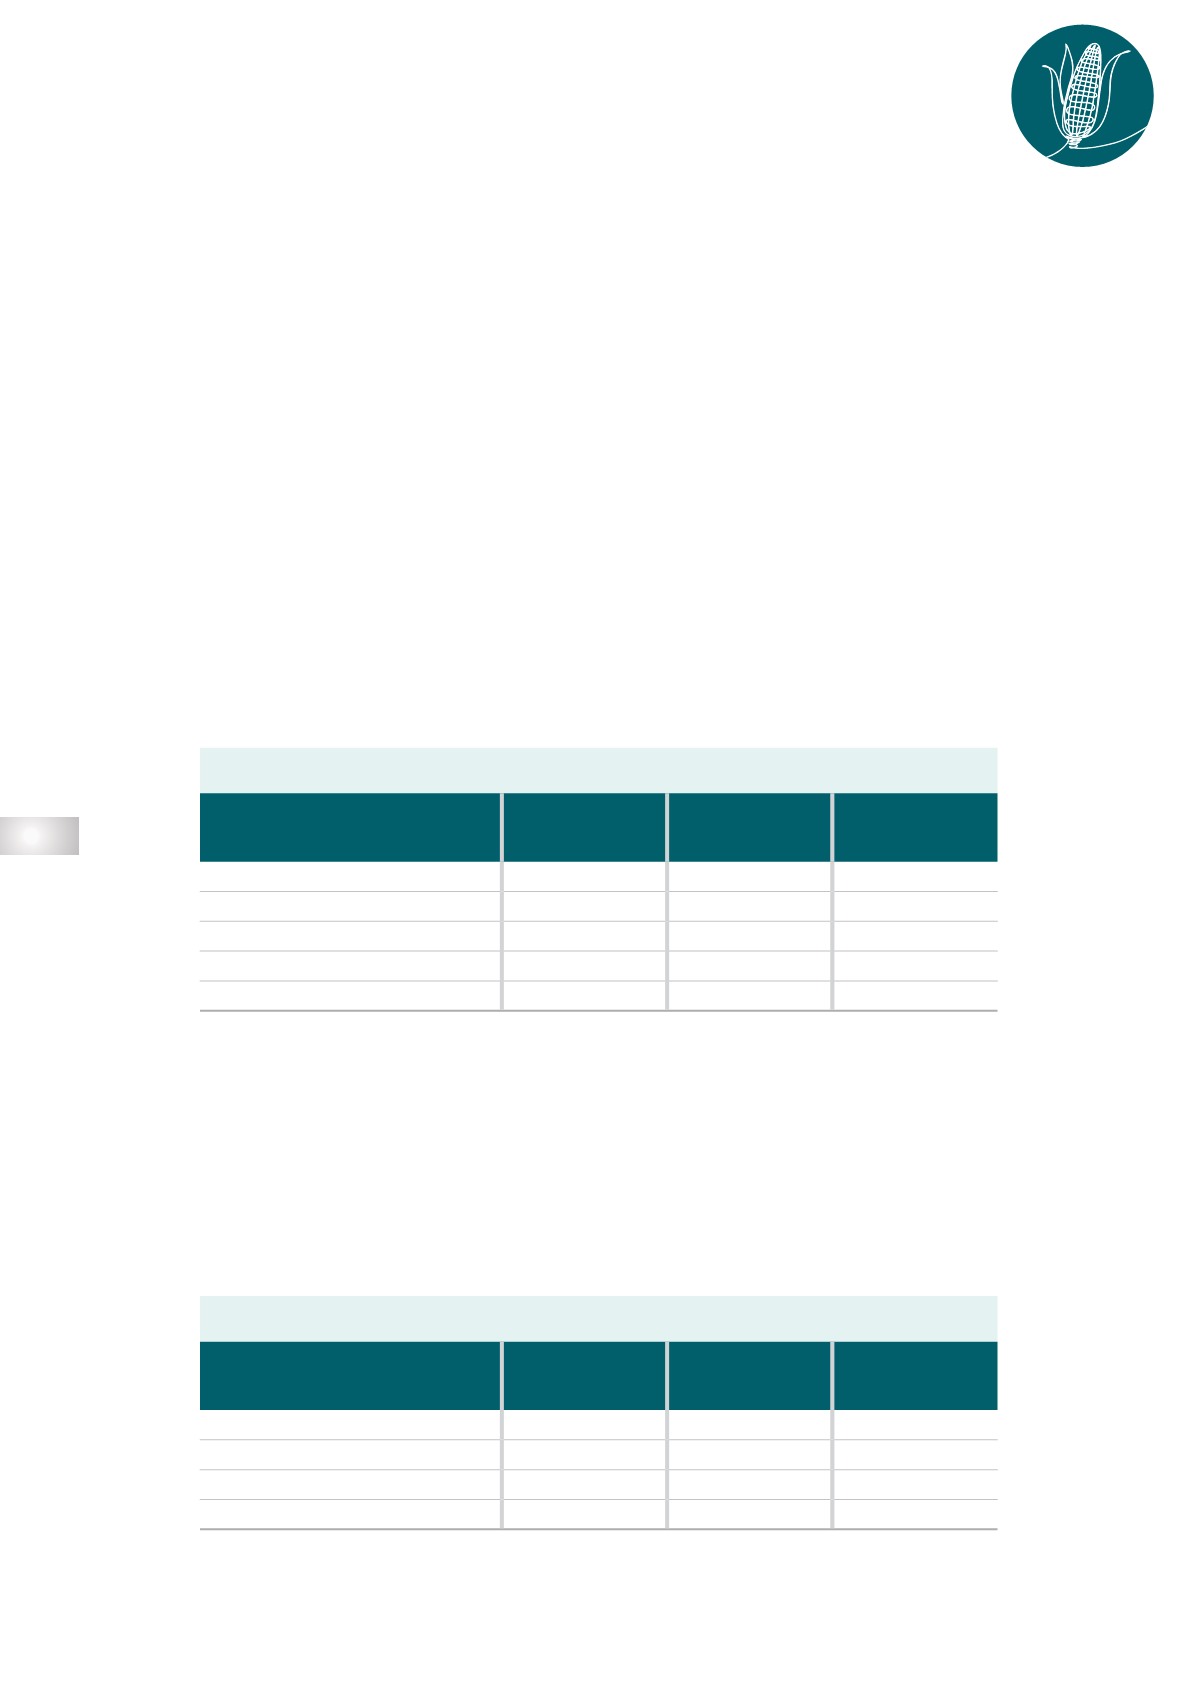
TABLE 1
TABLE 2
INTERNATIONAL FERTILISER PRICES IN DOLLAR TERMS
INTERNATIONAL FERTILISER PRICES IN RAND TERMS
International fertiliser prices in dollar terms
FERTILISER
SEP 2021
DOLLAR/TON
SEP 2022
DOLLAR/TON
% CHANGE
Ammonia (Middle East)
587
964
+64,2
Urea (46) (Eastern Europe)
490
610
+24,5
DAP (USA Gulf)
673
784
+16,5
KCL (CIS)
533
738
+38,5
Rand/dollar exchange rate
14,59
17,55
+20,3
International fertiliser prices in rand terms
FERTILISER
SEP 2021
RAND/TON
SEP 2022
RAND/TON
% CHANGE
Ammonia (Middle East)
8 564
16 918
+97,5
Urea (46) (Eastern Europe)
7 149
10 706
+49,7
DAP (USA Gulf)
9 819
13 759
+40,1
KCL (CIS)
7 776
12 952
+66,6
INPUT AND PRODUCTION OVERVIEW