


 69 / 138

65
MARKET OVERVIEW FOR THE
2021/2022 PRODUCTION SEASON
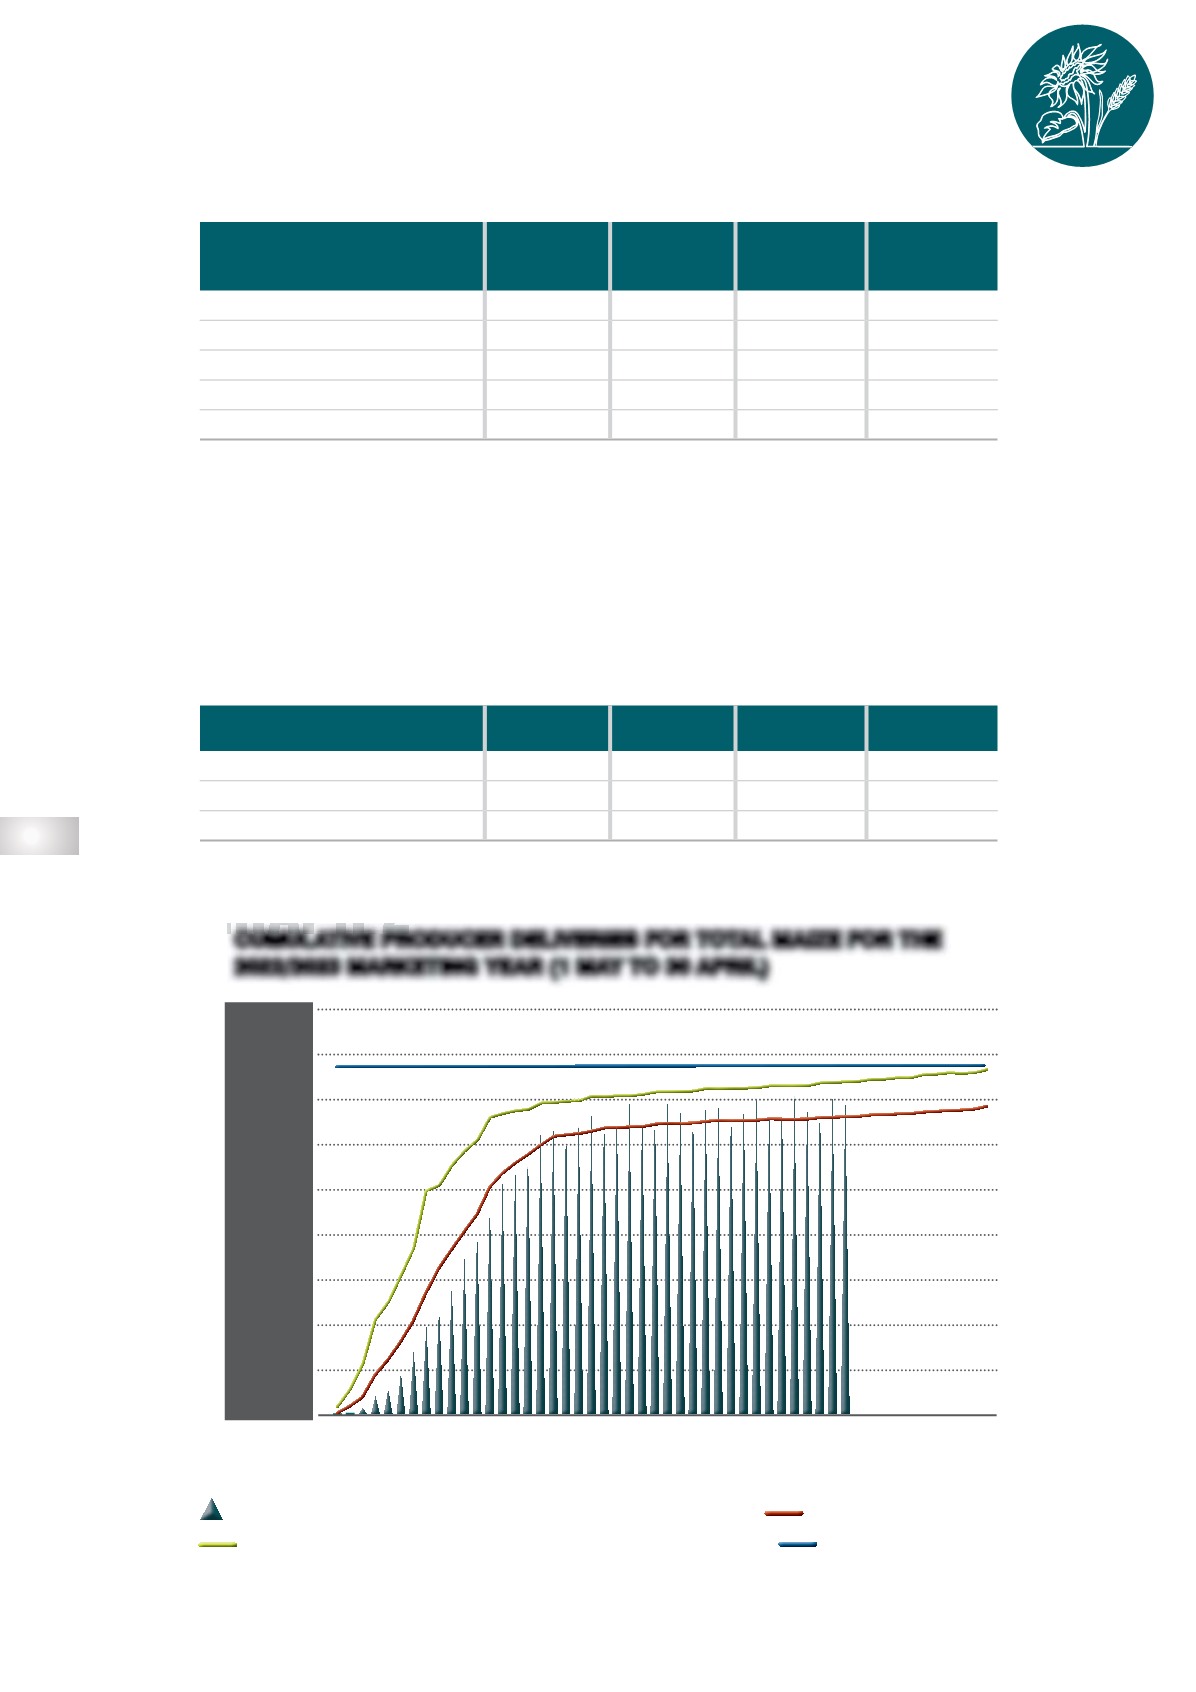
Graph 2
shows the producer delivery for the 2021/2022 season. The graph shows that producer de-
liveries were somewhat lower than the trend for the previous seasons. The season was characterised
by excessive rainfall during planting and harvesting. The excessive rain and moisture had a negative
effect on white-maize gradings.
Table 2
compares the 2021/2022 white-maize gradings with those of
previous seasons.
TABLE 1
TABLE 2
PRODUCTION OVERVIEW FOR MAIZE (2021/2022)
WHITE-MAIZE GRADINGS FOR THE 2021/2022 PRODUCTION SEASON
2020/2021 2021/2022
5-YEAR
AVERAGE
10-YEAR
AVERAGE
Total planted (hectares)
2 755 400 2 623 000
2 521 700
2 530 600
White
1 691 900 1 575 000
1 489 940
1 472 400
Yellow
1 063 500 1 048 000
1 031 800
1 058 200
Total production (tons)
16 315 000 15 259 800 14 132 000 13 127 400
Average yield (tons/ha)
5,92
5,82
5,60
5,19
WM1
WM2
WM3
WMO
2021/2022 production season
72,93% 22,50%
4,51%
0,06%
2020/2021 production season
96,42% 3,26%
0,30%
0,02%
Five-year average
91,45%
6,64%
1,54%
0,38%
SAGIS: PRODUCER DELIVERIES 2022/2023 MARKETING YEAR
GRAPH 2
CUMULATIVE PRODUCER DELIVERIES FOR TOTAL MAIZE FOR THE
2022/2023 MARKETING YEAR (1 MAY TO 30 APRIL)
SAGIS: PRODUCER DELIVERIES 2022/2023 MARKETING YEAR
NOK
5-YEAR AVERAGE
Week 1
Week 3
Week 5
Week 7
Week 9
Week 11
Week 13
Week 15
Week 17
Week 19
Week 21
Week 23
Week 25
Week 27
Week 29
Week 31
Week 33
Week 35
Week 37
Week 39
Week 41
Week 43
Week 45
Week 47
Week 49
Week 51
18 000 000
16 000 000
14 000 000
12 000 000
10 000 000
8 000 000
6 000 000
4 000 000
2 000 000
0
tons