


 68 / 138

64
Production conditions in the 2021/2022 production season
for summer grains and winter cereals
T
he 2021/2022 production season was not without its challenges. Summer grain pro-
ducers were subject to excessive rains during planting and harvesting, while winter
cereal producers experienced below-average rainfall during the production season.
Producers farmed amidst the La Niña weather cycle for the third consecutive year.
The planted area for oilseeds increased this season – soybeans by 12% (98 200 hectares) and sun-
flowers by 40% (192 200 hectares). Winter cereals in general showed an increase in planted area this
season. Planting of all the crops was affected by high input costs, which affected planting decisions.
MAIZE
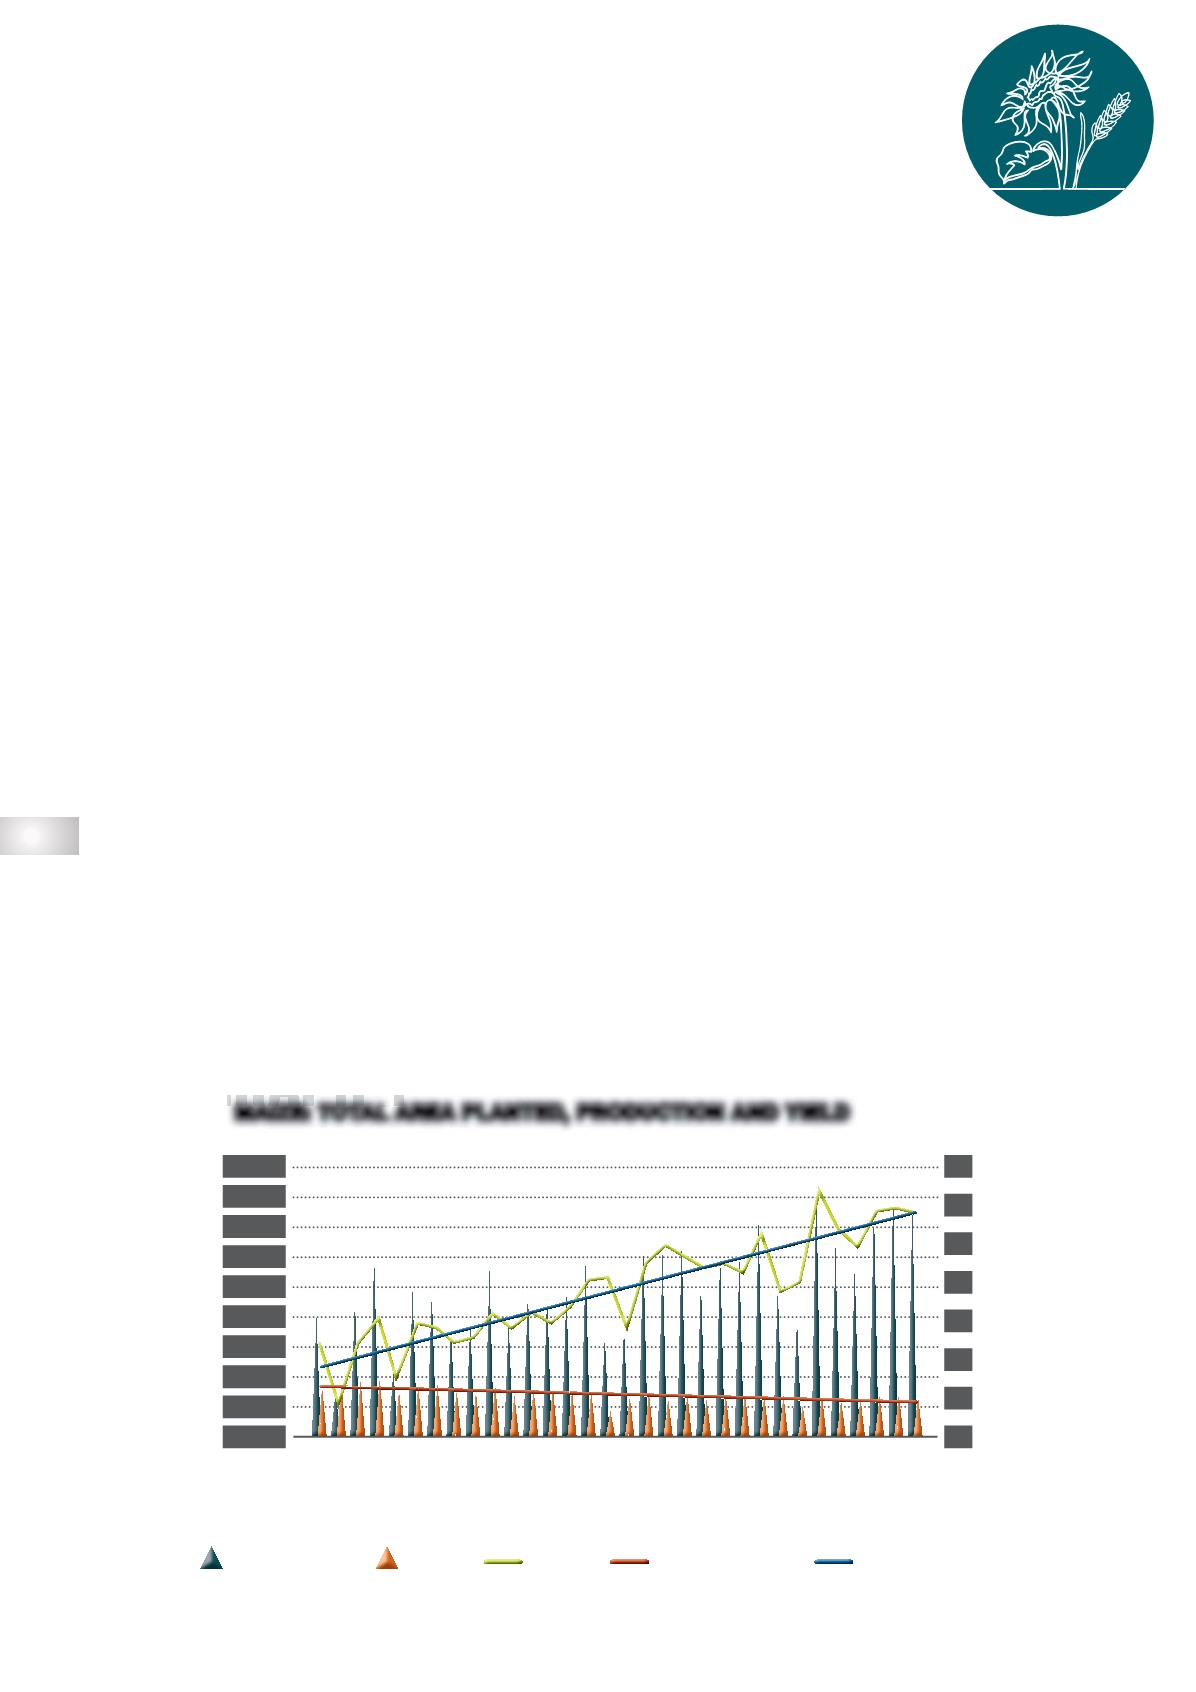
The total area planted for the 2021/2022 season was reduced a little to 2,62 million hectares. This is
132 400 ha (4,58%) less than in the 2020/2021 season, and 92 400 ha (3,65%) more than the ten-
year average. Total maize production decreased somewhat to 15 259 800 tons year-on-year (-6,47%
compared to the 2020/2021 production season). Production was 2 132 400 tons (1,62%) higher than
the ten-year average. Plantings were affected by high input costs this season. Producers’ planting
decisions were affected by the relatively cheaper production costs of soybeans. More hectares of
white maize than yellow maize were planted this season. Of the total planted area, 60% was white
maize and 40% yellow maize.
Graph 1
shows the total production of white and yellow maize, as
well as the ratio between the white- and yellow-maize production from the 1990/1991 season up
to the 2021/2022 season.
Table 1
contains a production overview of white and yellow maize in the
2021/2022 season.
MARKET OVERVIEW FOR THE
2021/2022 PRODUCTION SEASON
1990/1991
1991/1992
1992/1993
1993/1994
1994/1995
1995/1996
1996/1997
1997/1998
1998/1999
1999/2000
2000/2001
2001/2002
2002/2003
2003/2004
2004/2005
2005/2006
2006/2007
2007/2008
2008/2009
2009/2010
2010/2011
2011/2012
2012/2013
2013/2014
2014/2015
2015/2016
2016/2017
2017/2018
2018/2019
2019/2020
2020/2021
2021/2022*
*Preliminary
18 000
16 000
14 000
12 000
10 000
8 000
6 000
4 000
2 000
0
7
6
5
4
3
2
1
0
PRODUCTION
AREA
GRAPH 1
MAIZE: TOTAL AREA PLANTED, PRODUCTION AND YIELD
YIELD
LINEAR (YIELD)
LINEAR (AREA)
Thousand ha or ton
t/ha
EINDIG IN
ONBESTENDIGE JAAR
genade
SEISOEN VAN
DRYER
winter regions
EXCESSIVE RAIN FOR SUMMER AREAS;