


 64 / 116

62
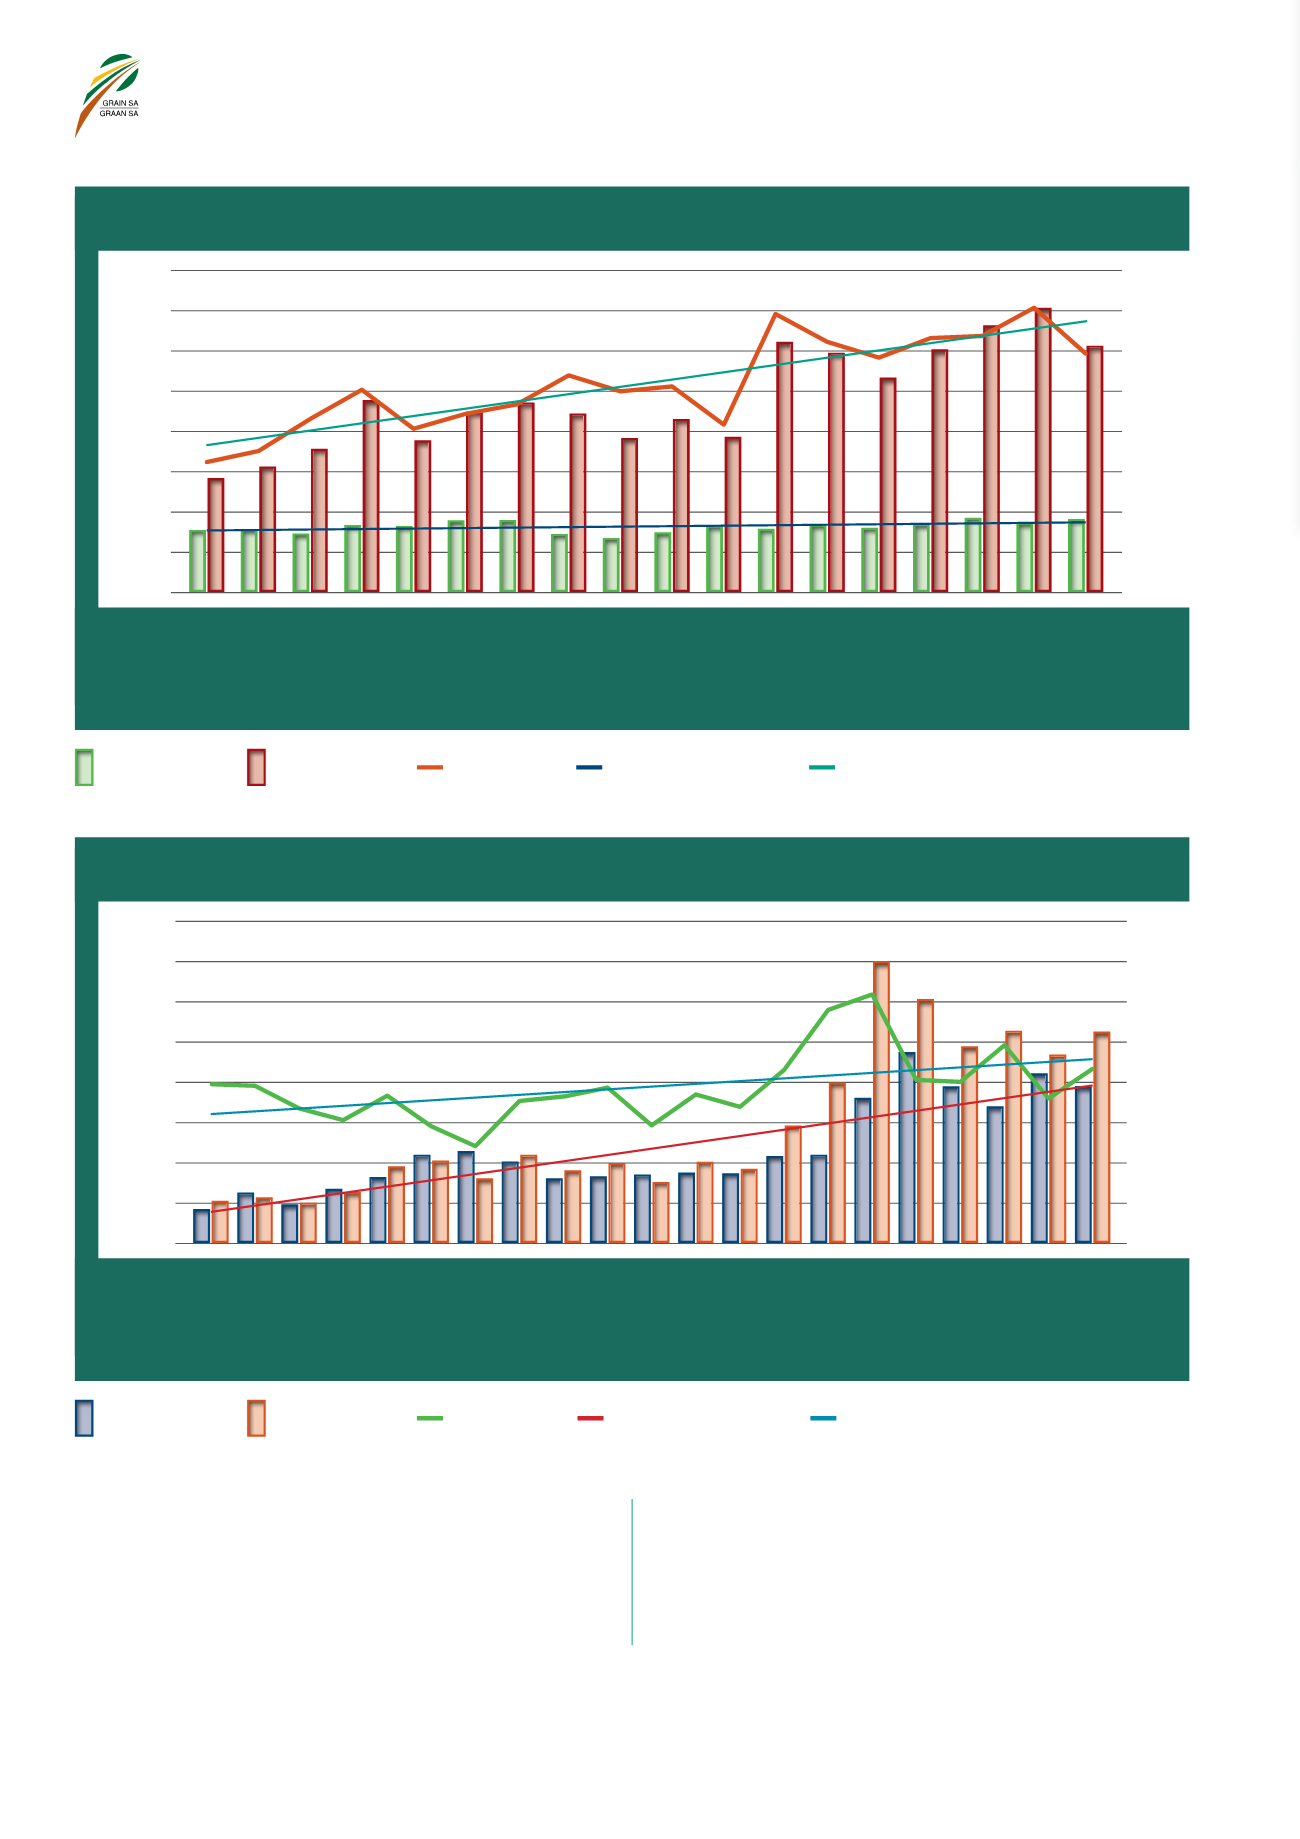
Die gemiddelde opbrengs vir die 2018/2019-seisoen was 1,36 t/ha
teenoor die vorige seisoen se 1,11 t/ha en die tienjaar gemiddelde
opbrengs van 1,1 t/ha. Weersomstandighede in die Wes-Kaap, waar
al die land se kanola geproduseer word, was vir die grootste gedeelte
van die produksieseisoen ongunstig met droë toestande, maar het
tydens saadvulstadium goeie reëns ontvang – wat tot beter opbrengste
aanleiding gegee het.
The average yield for the 2018/2019 season was 1,36 t/ha, compared to
the 1,11 t/ha for the previous season and the ten-year average yield of
1,1 t/ha. Weather conditions in the Western Cape, where all the country’s
canola is produced, were unfavourable, with dry conditions prevailing
for the biggest part of the production season. However, during the seed-
filling stage good rains were received, which led to better yields.
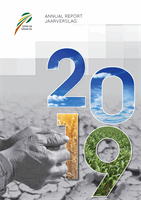
400
350
300
250
200
150
100
50
0
4,5
4
3,5
3
2,5
2
1,5
1
0,5
0
t/ha
Thousand ha or ton
Duisend ha of ton
GRAPH 7 – Malting barley: Area planted, production and yield.
GRAFIEK 7 – Moutgars: Oppervlakte geplant, produksie en opbrengs.
2000/2001
2001/2002
2002/2003
2003/2004
2004/2005
2005/2006
2006/2007
2007/2008
2008/2009
2009/2010
2010/2011
2011/2012
2012/2013
2013/2014
2014/2015
2015/2016
2016/2017
2017/2018
Production
Produksie
Area
Oppervlakte
Yield
Opbrengs
Linear (Area)
Linieêr (Oppervlakte)
Linear (Yield)
Linieêr (Opbrengs)
160
140
120
100
80
60
40
20
0
2,5
2
1,5
1
0,5
0
t/ha
Thousand ha or ton
Duisend ha of ton
GRAPH 8 – Canola: Area planted, production and yield.
GRAFIEK 8 – Kanola: Oppervlakte geplant, produksie en opbrengs.
1998/1999
1999/2000
2000/2001
2001/2002
2002/2003
2003/2004
2004/2005
2005/2006
2006/2007
2007/2008
2008/2009
2009/2010
2010/2011
2011/2012
2012/2013
2013/2014
2014/2015
2015/2016
2016/2017
2017/2018*
2018/2019*
Production
Produksie
Area
Oppervlakte
Yield
Opbrengs
Linear (Area)
Linieêr (Oppervlakte)
Linear (Yield)
Linieêr (Opbrengs)
* Preliminary/Voorlopig