


 59 / 116

57
the 2017/2018 season. With a decrease of approximately 4,6%,
yellow maize showed the biggest decrease in area planted compared
to the previous season, while the area of white maize increased by
approximately 2,4% for the season.
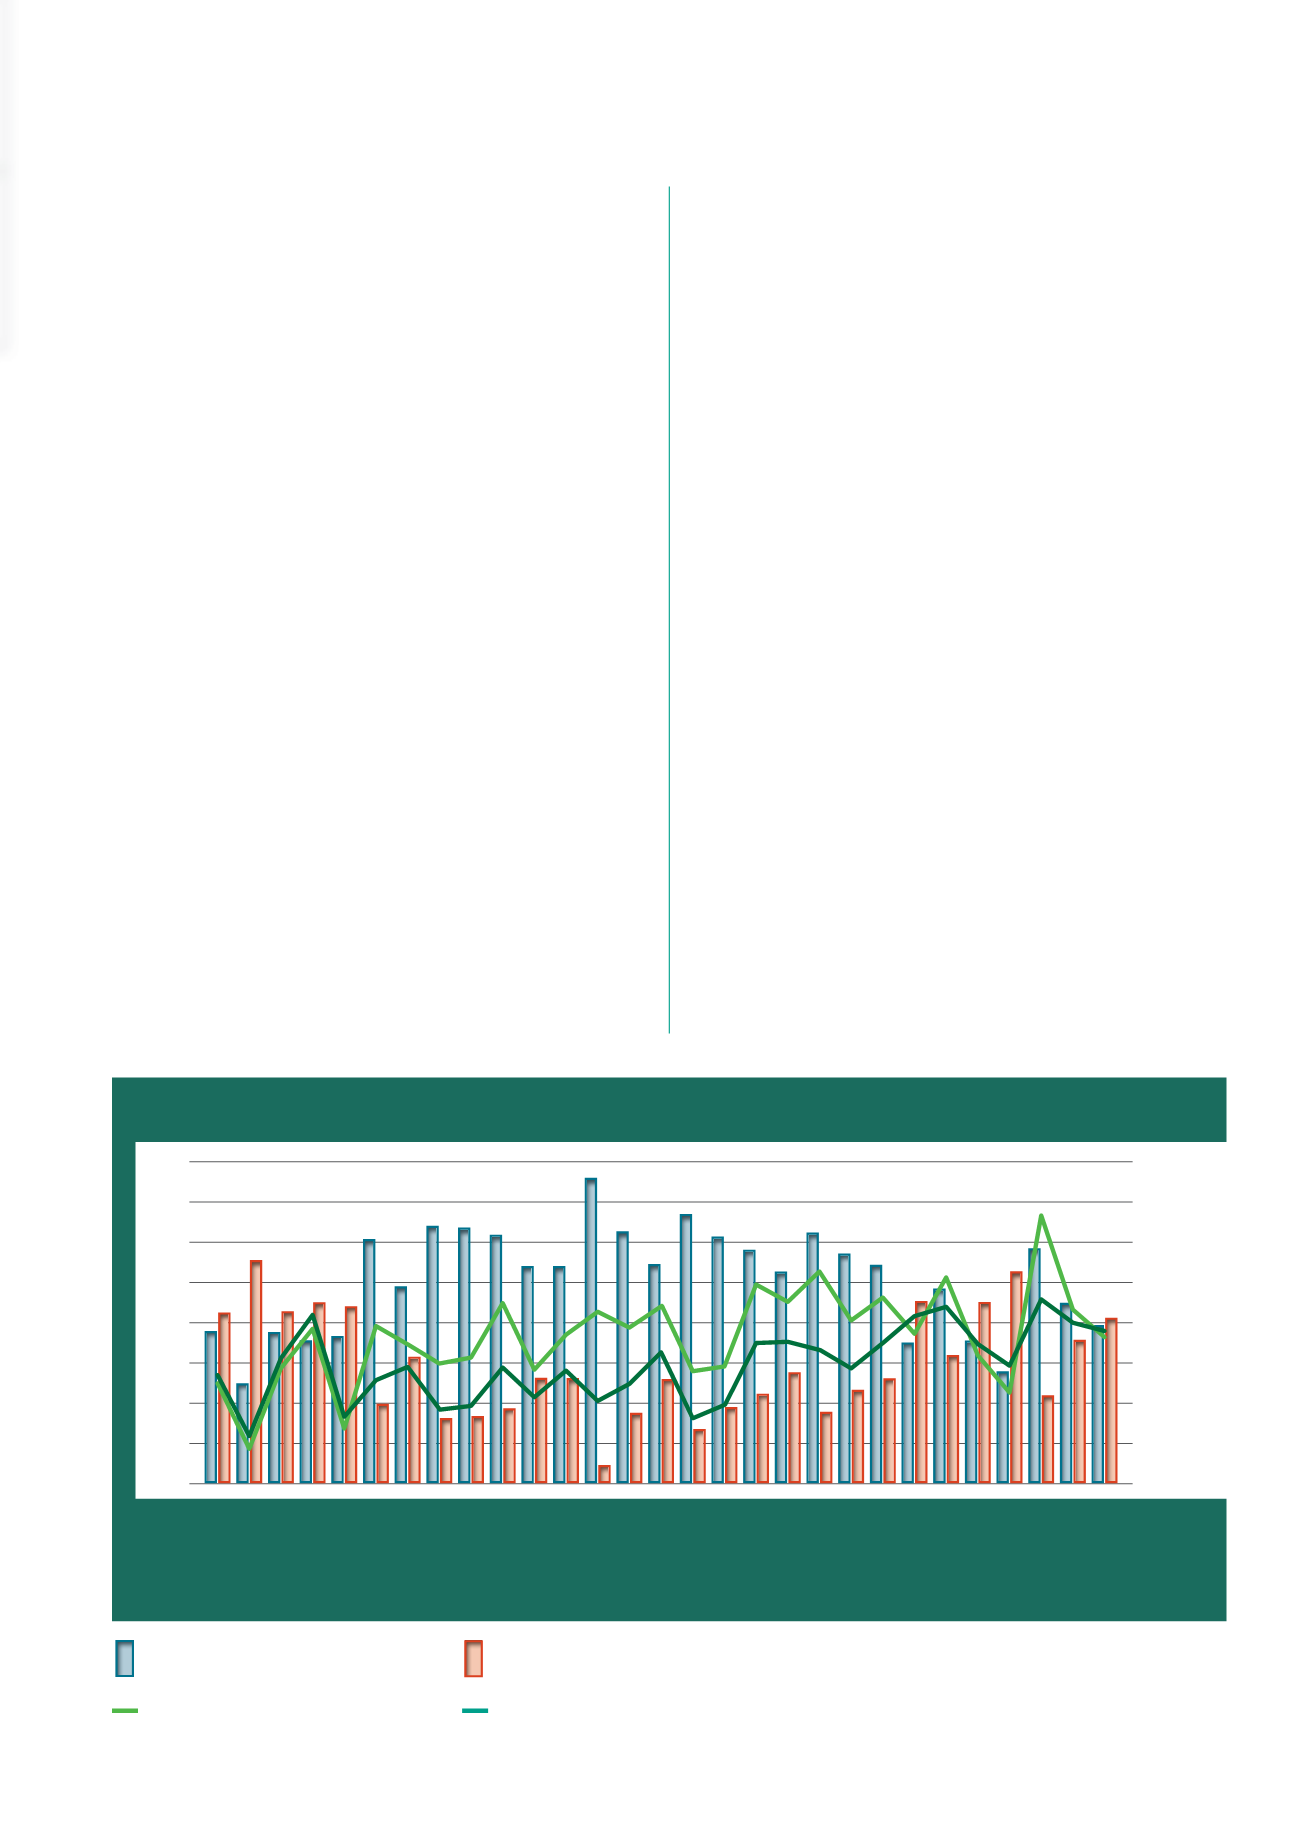
Graph 1
shows the total production
of white and yellow maize, as well as the ratio between the white
and yellow maize production from the 1990/1991 season up to the
2018/2019 season. It is clear that the production figures for white and
yellow maize were once again close together in the 2018/2019 season,
with the yellow maize production for the season at 50,5% of the total,
and the white maize production for the season at 49,5%.
Soybeans
The 2018/2019 production for soybeans was challenging, with
conditions in the biggest part of the country being mainly unfavourable
for the production of soybeans. Soybean plantings were not optimal
and the total area of 730 500 ha planted was 7,2% smaller than the
area planted during the 2017/2018 season.
Total production for 2018/2019 was estimated at 1,17 million tons,
which is 24% lower than the production for the previous season.
The average yield for the 2018/2019 season was 1,6 t/ha, which is
considerably lower than the 1,96 t/ha for the previous season, and
also the average yield of 1,83 t/ha for the past five years.
Graph 2
(on
page 58) shows the total area planted, production and the average
yield of soybeans since the 1990/1991 season.
Sunflower seed
The area of 515 350 ha of sunflower seed planted during the
2018/2019 production season was approximately 14% smaller than
that for the previous season. Production conditions for the season
were challenging, and plantings could only take place later than
usual, which meant that not all the planned hectares could be planted.
Sunflower seed production for the 2018/2019 season was estimated at
680 940 tons, with an average yield of 1,32 t/ha. This was lower than
the previous season’s yield of 1,43 t/ha, but slightly higher than the
average yield of 1,27 t/ha for the past five years.
Graph 3
(on page 58)
shows the total area planted, production and the average yield of
sunflower seed since the 1990/1991 season.
se aangeplante oppervlakte. Geelmielies het met ongeveer 4,6%
die grootste afname in aangeplante oppervlakte teenoor die vorige
seisoen getoon terwyl die witmielie-oppervlakte met sowat 2,4% vir die
seisoen toegeneem het.
Grafiek 1
toon die totale produksie van wit- en
geelmielies asook die verhouding tussen die wit- en geelmielieproduksie
vanaf die 1990/1991-seisoen tot en met die 2018/2019-seisoen. Dit is
duidelik dat die verhouding van produksie tussen wit- en geelmielies
in die 2018/2019-seisoen weer baie naby aan mekaar was, met die
geelmielieproduksie vir die seisoen wat 50,5% van die totaal uitgemaak
het terwyl die witmielieproduksie vir die seisoen 49,5% beloop het.
Sojabone
Die 2018/2019-produksieseisoen vir sojabone was uitdagend met omstan-
dighede in die grootste gedeelte van die land wat meestal ongunstig was
vir die produksie van sojabone. Sojaboon-aanplantings kon nie optimaal
plaasvind nie en die totale oppervlakte van 730 500 ha was 7,2% laer as die
oppervlakte wat gedurende die 2017/2018-seisoen aangeplant is.
Produksie vir 2018/2019 word in totaliteit op 1,17 miljoen ton geskat;
wat 24% laer is as die vorige seisoen se produksie. Die gemiddelde
opbrengs vir die 2018/2019-seisoen was 1,6 t/ha wat aansienlik laer
is as die vorige seisoen se 1,96 t/ha en ook die afgelope vyf jaar se
gemiddelde opbrengs van 1,83 t/ha.
Grafiek 2
(op bladsy 58) toon die
totale aangeplante oppervlakte, produksie en gemiddelde opbrengs
van sojabone sedert die 1990/1991-seisoen.
Sonneblomsaad
Die sonneblomsaad oppervlakte van 515 350 ha wat gedurende die
2018/2019-produksieseisoen aangeplant is, was ongeveer 14% minder
as dié van die vorige seisoen. Produksietoestande vir die seisoen was
uitdagend gewees en aanplantings kon later as normaal eers plaasvind
– wat veroorsaak het dat nie al die beplande hektare aangeplant kon
word nie. Sonneblomsaad-produksie vir die 2018/2019-seisoen word op
680 940 ton geskat teen ’n gemiddelde opbrengs van 1,32 t/ha. Dit is
laer as die vorige seisoen se opbrengs van 1,43 t/ha, maar effens hoër as
die afgelope vyf jaar se gemiddelde opbrengs van 1,27 t/ha.
Grafiek 3
(op bladsy 58) toon die totale oppervlakte aangeplant, produksie en
gemiddeldeopbrengsvansonneblomsaadsedertdie1990/1991-seisoen.
70
65
60
55
50
45
40
35
30
12 000
10 000
8 000
6 000
4 000
2 000
0
%
Thousand ton
Duisend ton
GRAPH 1 – Production of white and yellow maize.
GRAFIEK 1 – Produksie van wit- en geelmielies.
* Preliminary/Voorlopig
1990/1991
1991/1992
1992/1993
1993/1994
1994/1995
1995/1996
1996/1997
1997/1998
1998/1999
1999/2000
2000/2001
2001/2002
2002/2003
2003/2004
2004/2005
2005/2006
2006/2007
2007/2008
2008/2009
2009/2010
2010/2011
2011/2012
2012/2013
2013/2014
2014/2015
2015/2016
2016/2017
2017/2018
2018/2019*
White maize as % of total production
Witmielies as % van totale produksie
Yellow maize as % of total production
Geelmielies as % van totale produksie
White maize production (ton)
Witmielieproduksie (ton)
Yellow maize production (ton)
Geelmielieproduksie (ton)