


 62 / 116

60
250
200
150
100
50
0
2
1,8
1,6
1,4
1,2
1
0,8
0,6
0,4
0,2
0
t/ha
Thousand ha or ton
Duisend ha of ton
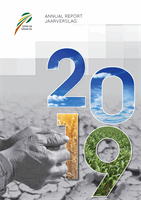
GRAPH 5 – Groundnuts: Area planted, production and yield.
GRAFIEK 5 – Grondbone: Oppervlakte geplant, produksie en opbrengs.
2000/2001
2001/2002
2002/2003
2003/2004
2004/2005
2005/2006
2006/2007
2007/2008
2008/2009
2009/2010
2010/2011
2011/2012
2012/2013
2013/2014
2014/2015
2015/2016
2016/2017
2017/2018
2018/2019*
Production
Produksie
Area
Oppervlakte
Yield
Opbrengs
Linear (Production)
Linieêr (Produksie)
Linear (Yield)
Linieêr (Opbrengs)
* Preliminary/Voorlopig
3 000
2 500
2 000
1 500
1 000
500
0
4
3,5
3
2,5
2
1,5
1
0,5
0
t/ha
Thousand ha or ton
Duisend ha of ton
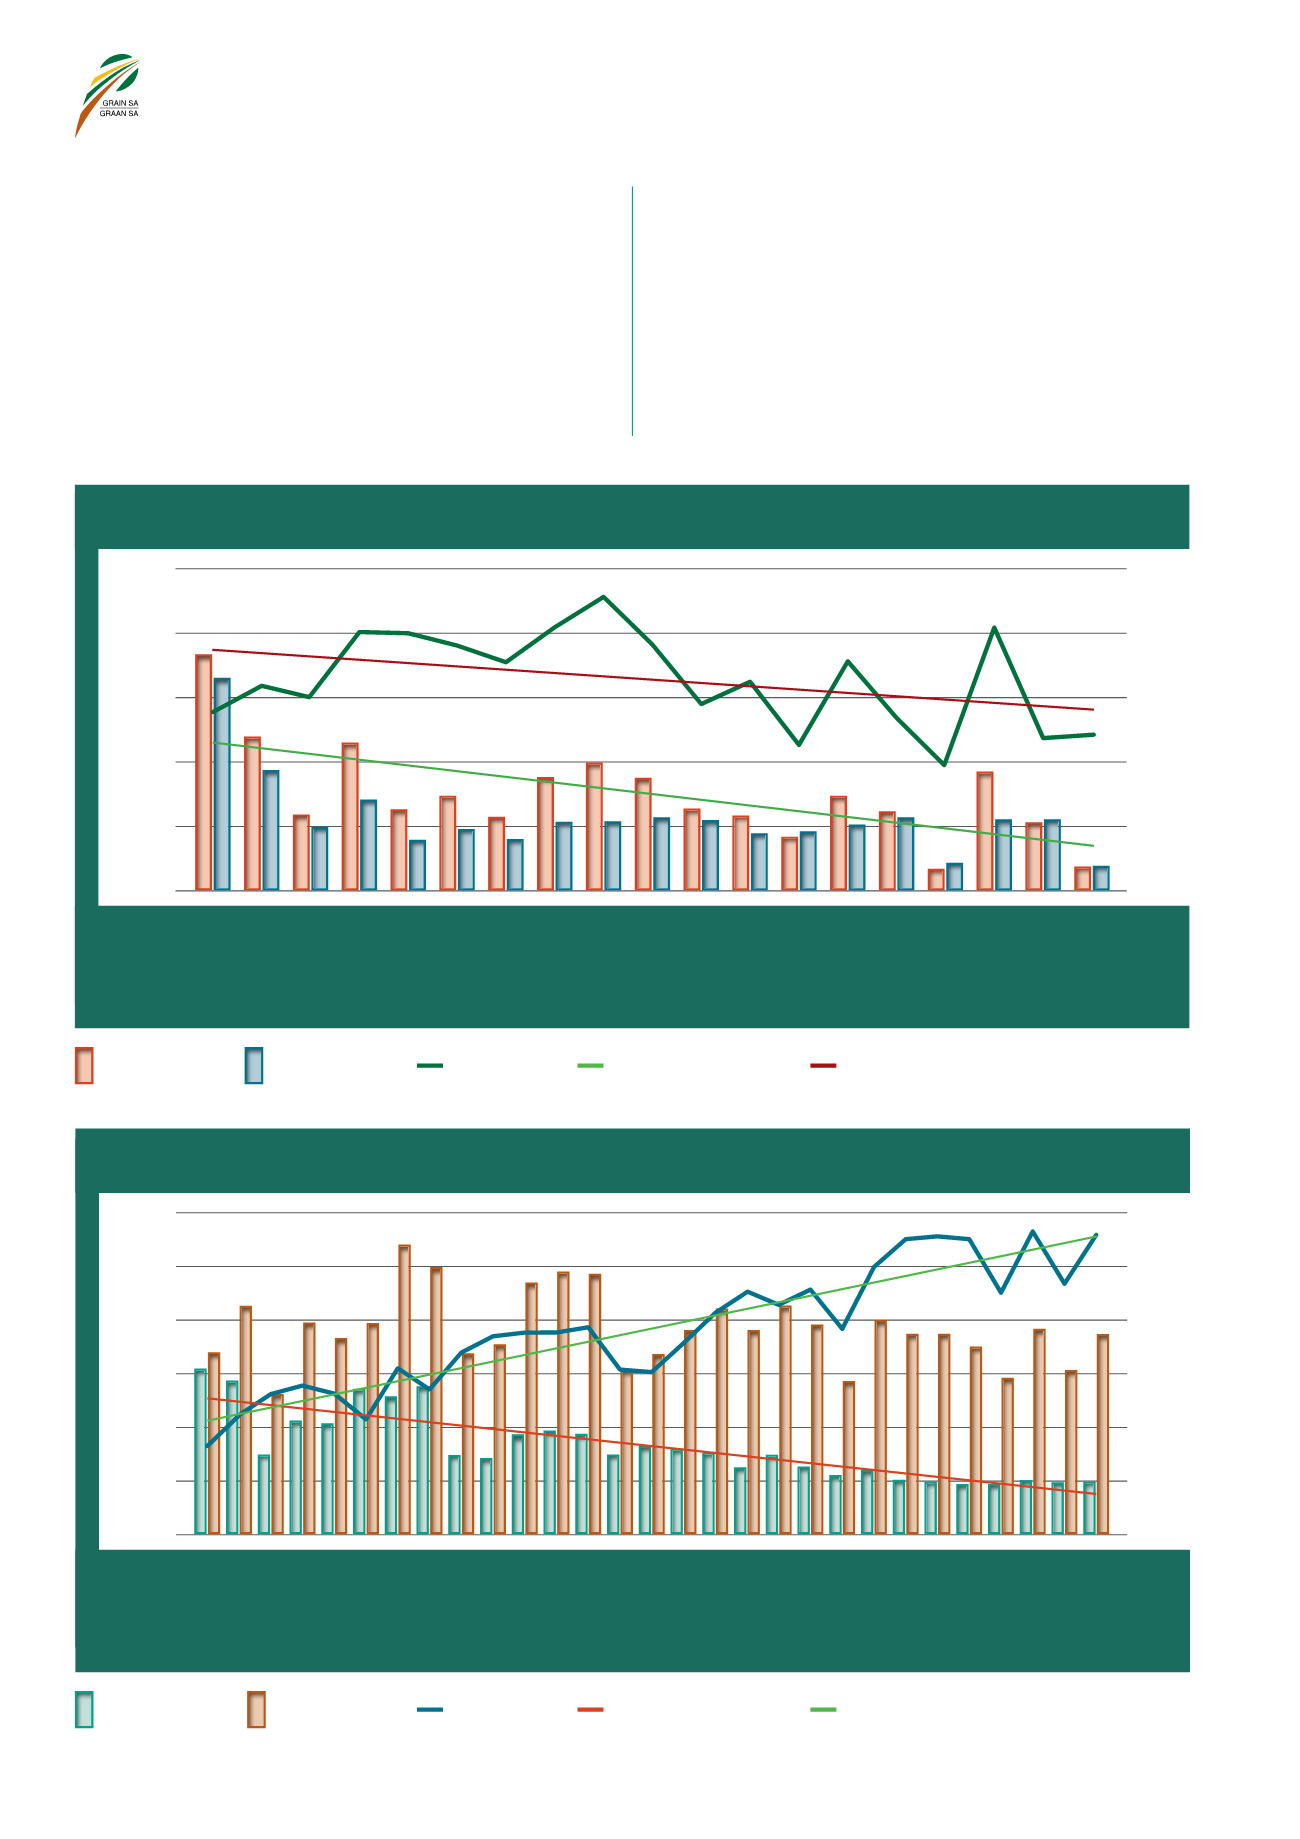
GRAPH 6 – Wheat: Area planted, production and yield.
GRAFIEK 6 – Koring: Oppervlakte geplant, produksie en opbrengs.
1990/1991
1991/1992
1992/1993
1993/1994
1994/1995
1995/1996
1996/1997
1997/1998
1998/1999
1999/2000
2000/2001
2001/2002
2002/2003
2003/2004
2004/2005
2005/2006
2006/2007
2007/2008
2008/2009
2009/2010
2010/2011
2011/2012
2012/2013
2013/2014
2014/2015
2015/2016
2016/2017
2017/2018
2018/2019
Production
Produksie
Area
Oppervlakte
Yield
Opbrengs
Linear (Area)
Linieêr (Oppervlakte)
Linear (Yield)
Linieêr (Opbrengs)
This higher production can be largely attributed to the wetter
conditions where the rain fell at the right time in the Western Cape,
with the total production for this province for the season reported at
890 500 tons – an increase of 34,1% from the wheat production for
the previous season in the Western Cape. The average yield for the
2018/2019 season was reported as 3,71 t/ha, which was higher than
the previous season’s average yield of 3,12 t/ha. The Western Cape’s
average yield for the 2018/2019 season was 2,8 t/ha, compared to
the previous season’s 1,8 t/ha.
Graph 6
shows the total area planted,
production and the average yield of wheat since the 1990/1991
season.
Dié hoër produksie kan grootliks toegeskryf word aan die natter
toestande waar die neerslag op die regte tye in die Wes-Kaap
voorgekom het, met hierdie provinsie se totale produksie vir die seisoen
wat op 890 500 ton gerapporteer is – ’n styging van 34,1% vanaf die
vorige seisoen se koringproduksie in die Wes-Kaap. Die gemiddelde
opbrengs vir die 2018/2019-seisoen is op 3,71 t/ha gerapporteer, wat
hoër was as die vorige seisoen se gemiddelde opbrengs van 3,12 t/ha.
Die Wes-Kaap se gemiddelde opbrengs vir die 2018/2019-seisoen
was 2,8 t/ha teenoor die vorige seisoen se 1,8 t/ha.
Grafiek 6
toon die
aangeplante koringoppervlakte, produksie en gemiddelde opbrengs
sedert die 1990/1991-seisoen.