


 60 / 116

58
1 600
1 400
1 200
1 000
800
600
400
200
0
2,5
2
1,5
1
0,5
0
t/ha
Thousand ha and ton
Duisend ha en ton
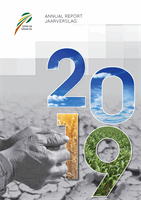
GRAPH 2 – Soybeans: Area planted, production and yield.
GRAFIEK 2 – Sojabone: Oppervlakte geplant, produksie en opbrengs.
1990/1991
1991/1992
1992/1993
1993/1994
1994/1995
1995/1996
1996/1997
1997/1998
1998/1999
1999/2000
2000/2001
2001/2002
2002/2003
2003/2004
2004/2005
2005/2006
2006/2007
2007/2008
2008/2009
2009/2010
2010/2011
2011/2012
2012/2013
2013/2014
2014/2015
2015/2016
2016/2017
2017/2018
2018/2019*
Production
Produksie
Area
Oppervlakte
Yield
Opbrengs
Linear (Area)
Linieêr (Oppervlakte)
Linear (Yield)
Linieêr (Opbrengs)
* Preliminary/Voorlopig
1 200
1 000
800
600
400
200
0
1,8
1,6
1,4
1,2
1
0,8
0,6
0,4
0,2
0
t/ha
Thousand ha or ton
Duisend ha of ton
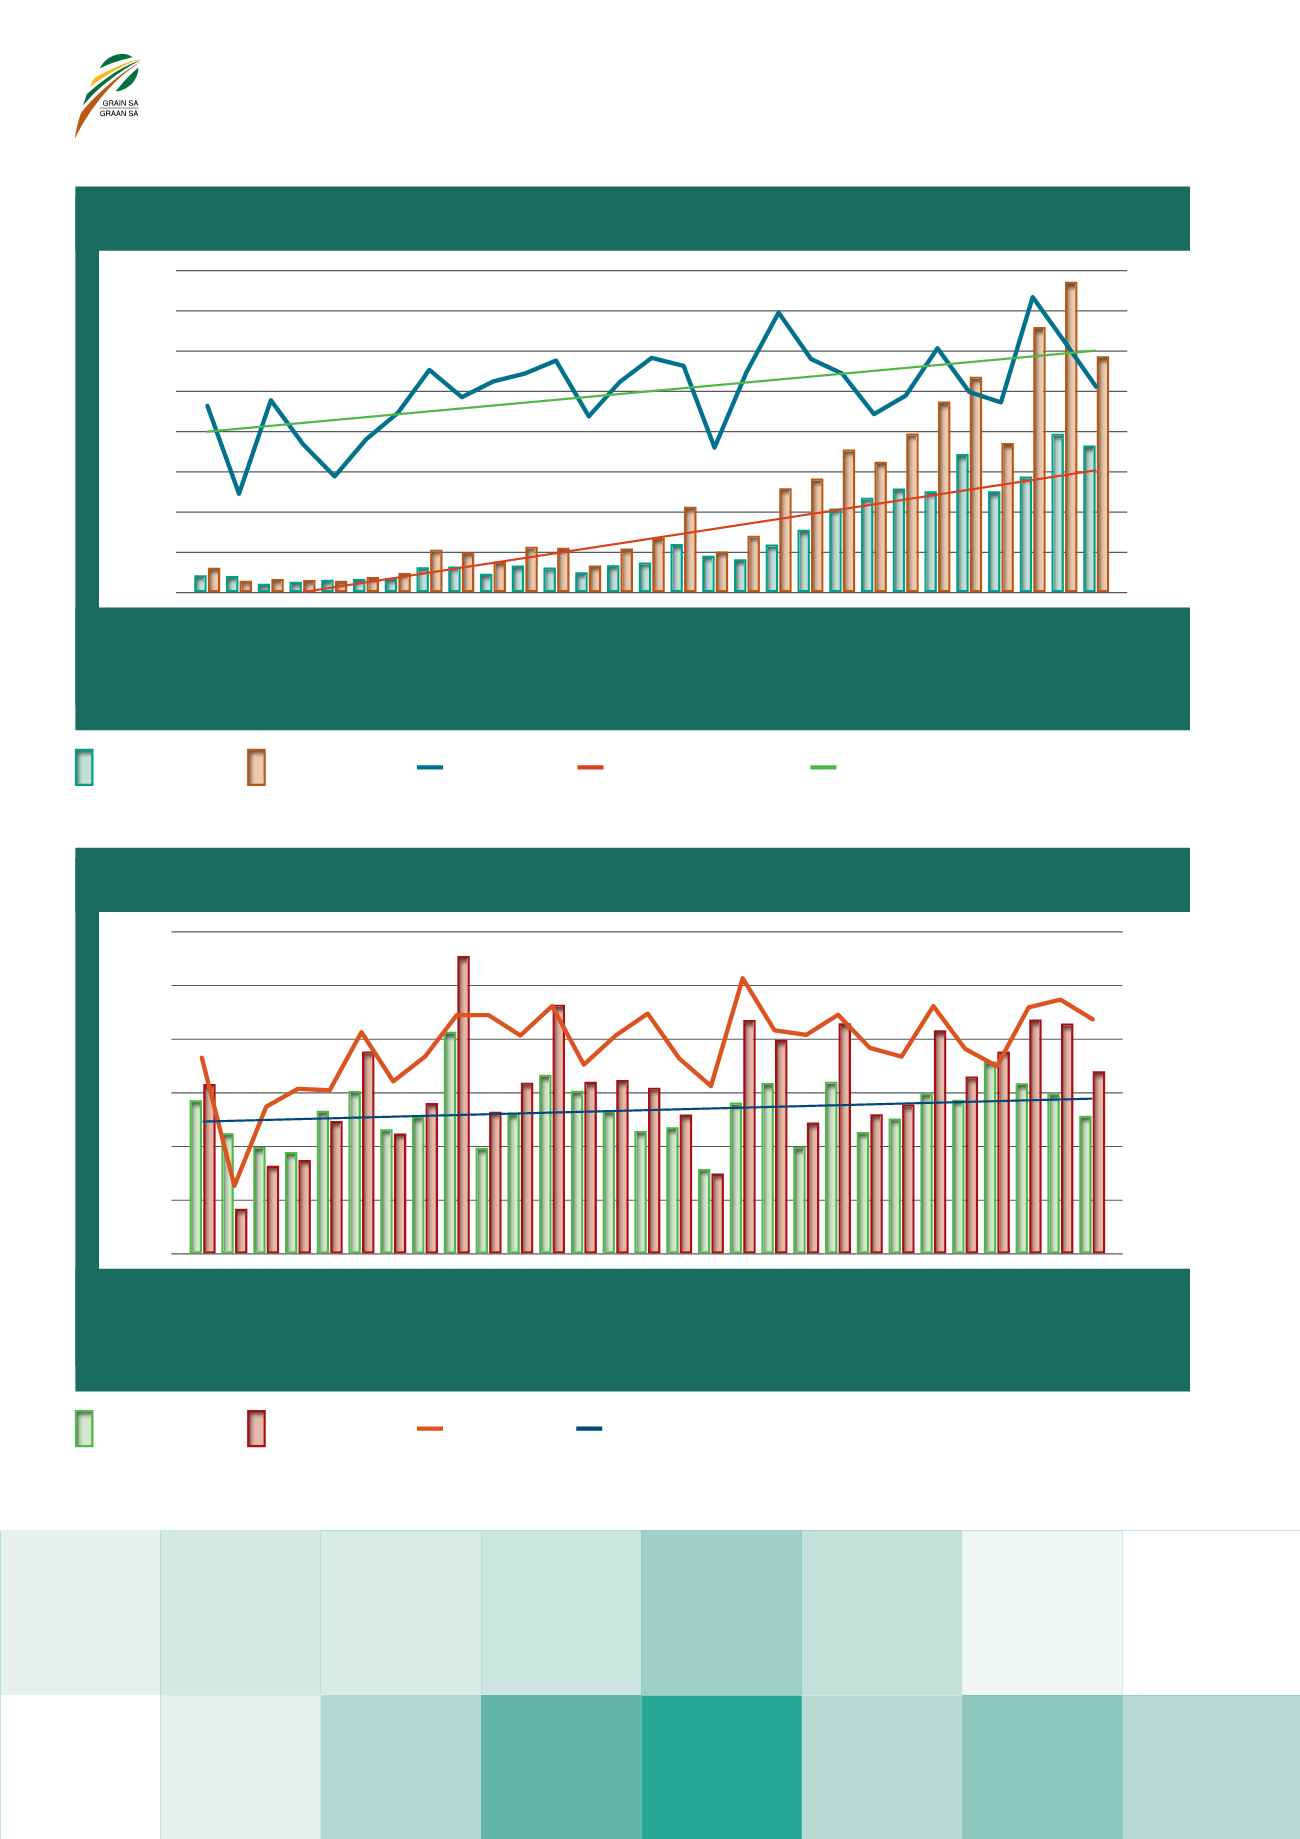
GRAPH 3 – Sunflower seed: Area planted, production and yield.
GRAFIEK 3 – Sonneblomsaad: Oppervlakte geplant, produksie en opbrengs.
1990/1991
1991/1992
1992/1993
1993/1994
1994/1995
1995/1996
1996/1997
1997/1998
1998/1999
1999/2000
2000/2001
2001/2002
2002/2003
2003/2004
2004/2005
2005/2006
2006/2007
2007/2008
2008/2009
2009/2010
2010/2011
2011/2012
2012/2013
2013/2014
2014/2015
2015/2016
2016/2017
2017/2018
2018/2019*
Production
Produksie
Area
Oppervlakte
Yield
Opbrengs
Linear (Area)
Linieêr (Oppervlakte)
* Preliminary/Voorlopig