


 103 / 138

99
INPUT AND PRODUCTION OVERVIEW
Eastern parts of the country
Table 9
(on page 100) sets out the production costs for the eastern parts of the country (Eastern
Free State and Eastern Highveld). The production costs of maize, sunflower and soybeans with
different yield targets are compared for the Eastern Free State whereas only maize and soybeans
are compared in the Eastern Highveld. According to the production cost calculations, the variable
costs of producing maize in the Eastern Free State for a yield target of 5,0 t/ha is ± R15 831/ha, while
it is ± R19 154/ha for a yield target of 6,0 t/ha in the Eastern Highveld. The estimated total maize
variable costs for the 2022/2023 production season have increased between R4 400 and R5 000 per
hectare since the previous season for the eastern parts of the country, with fertiliser being the main
input component that brought about the increases. If this Safex price is realised at the estimated
budgeted input costs (excluding fixed costs), a producer in the Eastern Free State will have to harvest
4,22 t/ha to break even, whereas a producer in the Eastern Highveld needs to harvest 5,06 t/ha.
When the break-even yields for the total costs (including fixed costs) are calculated and the total
costs of a maize producer are covered, it becomes a serious problem and concern, especially
because Safex prices are at exceptionally high levels. If prices are under pressure it would also put
the profitability under pressure.
GRAPH 22
MARGIN COMPARISON FOR SUMMER GRAIN CROPS IN NORTH WEST AND
THE NORTH-WEST AND CENTRAL FREE STATE FOR THE 2022/2023 SEASON
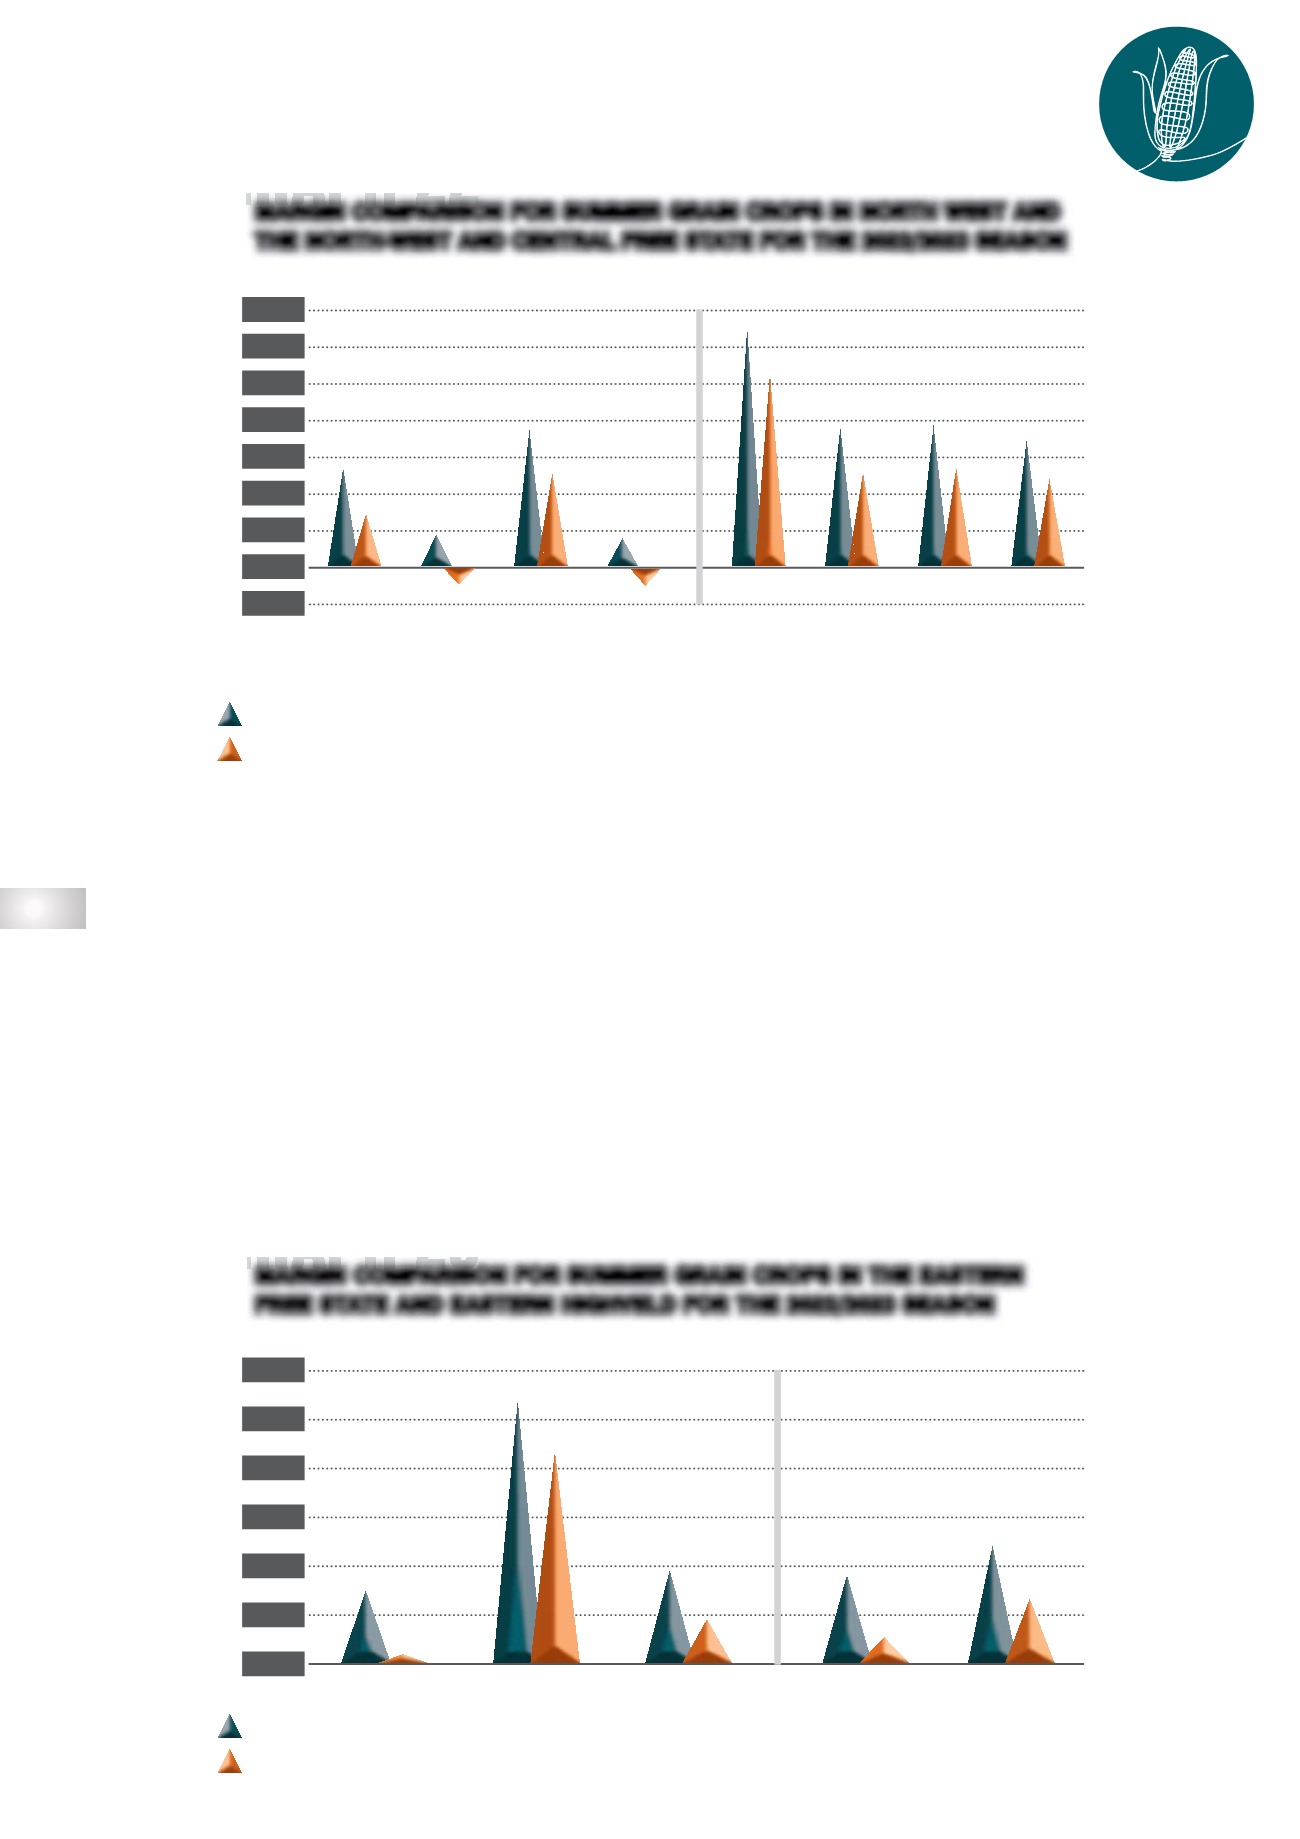
GRAPH 23
MARGIN COMPARISON FOR SUMMER GRAIN CROPS IN THE EASTERN
FREE STATE AND EASTERN HIGHVELD FOR THE 2022/2023 SEASON
MAIZE
(HIGHER
YIELD)
MAIZE SUNFLOWER SOYBEANS
MAIZE
SUNFLOWER
SOYBEANS
MAIZE
(HIGHER
YIELD)
MAIZE SUNFLOWER SOYBEANS
MAIZE
SOYBEANS
14 000
12 000
10 000
8 000
6 000
4 000
2 000
0
-2 000
12 000
10 000
8 000
6 000
4 000
2 000
0
GROSS MARGINS (VARIABLE COSTS ONLY)
GROSS MARGINS (VARIABLE COSTS ONLY)
NET MARGINS (TOTAL COSTS = VARIABLE + FIXED COSTS)
NET MARGINS (TOTAL COSTS = VARIABLE + FIXED COSTS)
R
R
NORTH WEST PROVINCE
EASTERN FREE STATE
R5 329
R2 934
R10 683
R3 778
R1 689
R7 355
R13 049
R7 532 R7 625
R6 856
R3 580
R4 760
R1 449
R2 777
R335
R8 606
R1 815
-R862
-R958
R5 000
R10 477
R5 075
R5 269 R4 677
R1 047
R2 611
NORTH-WEST AND CENTRAL FREE STATE
EASTERN HIGHVELD