


 5 / 116

ISSN 1814-1676
EIENAAR/uitgewer
Graan SA
Posbus 74087, LYNNWOOD RIDGE, 0040
Tel: 086 004 7246
www.grainsa.co.za
SUBSKRIPSIE EN VERSPREIDING
(ADRESVERANDERINGE):
Marina Kleynhans
SA GRAAN/GRAIN,
POSBUS 88, BOTHAVILLE, 9660
Tel: 086 004 7246
E-pos:
marina@grainsa.co.za
REDAKSIE
Dr Dirk Strydom
BESTUURDER: GRAANEKONOMIE EN BEMARKING
Tel: 086 004 7246 • Sel: 082 852 4810
E-pos:
dirks@grainsa.co.za
REDAKTEUR:
Estie de Villiers
Tel: 081 236 0534 • Sel: 083 490 9449
E-pos:
estie@infoworks.biz
BESTURENDE redakteur:
Johan Smit
Tel: 018 468 2716 • Sel: 082 553 7806
E-pos:
johan@infoworks.biz
Redaksionele assistent:
Elmien Bosch
Tel: 018 468 2716 • E-pos:
elmien@infoworks.biz
GRAFIESE ONTWERP:
Nadine Stork
Infoworks Media Publishing
Tel: 018 468 2716 • E-pos
: nadine@infoworks.biz
Drukwerk:
Typo Print
Tel: 011 402 3468/9
MASSAVERSPREIDING:
Prosource
Tel: 011 791 0410
Spotprenttekenaar:
Frans Esterhuyse
Advertensieverkope
Kolbe MEDIA – Kaapstad
Jurgen van Onselen – Advertensiekoördineerder
Tel/faks: 021 976 4482 • Sel: 082 417 3874
E-pos:
jurgen@kolbemedia.co.za
SCHMILTZ marketing – Johannesburg
Ruth Schultz – Advertensiekonsultant
Tel: 081 480 6413 • Sel: 083 583 5243
E-pos:
ruth@schmiltz.co.za
Graan SA Hoofkantoor
Blok C, Alenti Office Park
Witheritestraat 457
Die Wilgers
Pretoria
0041
Tel: 086 004 7246
Faks: 012 807 3166
Besoek Graan SA by
www.grainsa.co.za
of skandeer dié
QR-kode:
• Die menings van die skrywers van artikels in hierdie blad
is hul eie en verteenwoordig nie noodwendig die mening
van Graan SA nie.
•
The opinions expressed by contributors are their own.
They do not necessarily express the opinion of Grain SA.
• “Promosie-artikels” is betaalde artikels; terwyl “produk-
inligting”-artikels feite kan bevat oor kommersiële produkte.
•
´Advertorials´ are paid articles; while ´product informa-
tion´ articles may contain facts on commercial products.
ALLE regte van reproduksie van alle berigte, foto’s, teke
ninge, advertensies en alle ander materiaal wat in hierdie
tydskrif gepubliseer word, word hiermee uitdruklik voorbe
hou ingevolge die bepalings van Artikel 12(7) van die Wet
op Outeursreg Nr. 98 van 1978 en enige wysigings daarvan.
The cover photograph was submitted by
Wimpie Cronje from Umbila Boerdery
(Standerton).
3
Voorblad
/
Cover
Oktober 2018
96
Local and
imported
WHEAT QUALITY
scrutinised
W
heat contributed 79% to the
totalwinter cereal cropproduc-
tion in South Africa during the
2017/2018 production season.
The Southern African Grain Laboratory
(SAGL) received and analysed 304 samples
to provide as best possible a proportional
representation of the production of wheat
in all the different production regions.
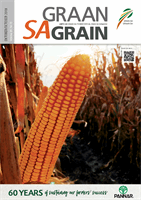
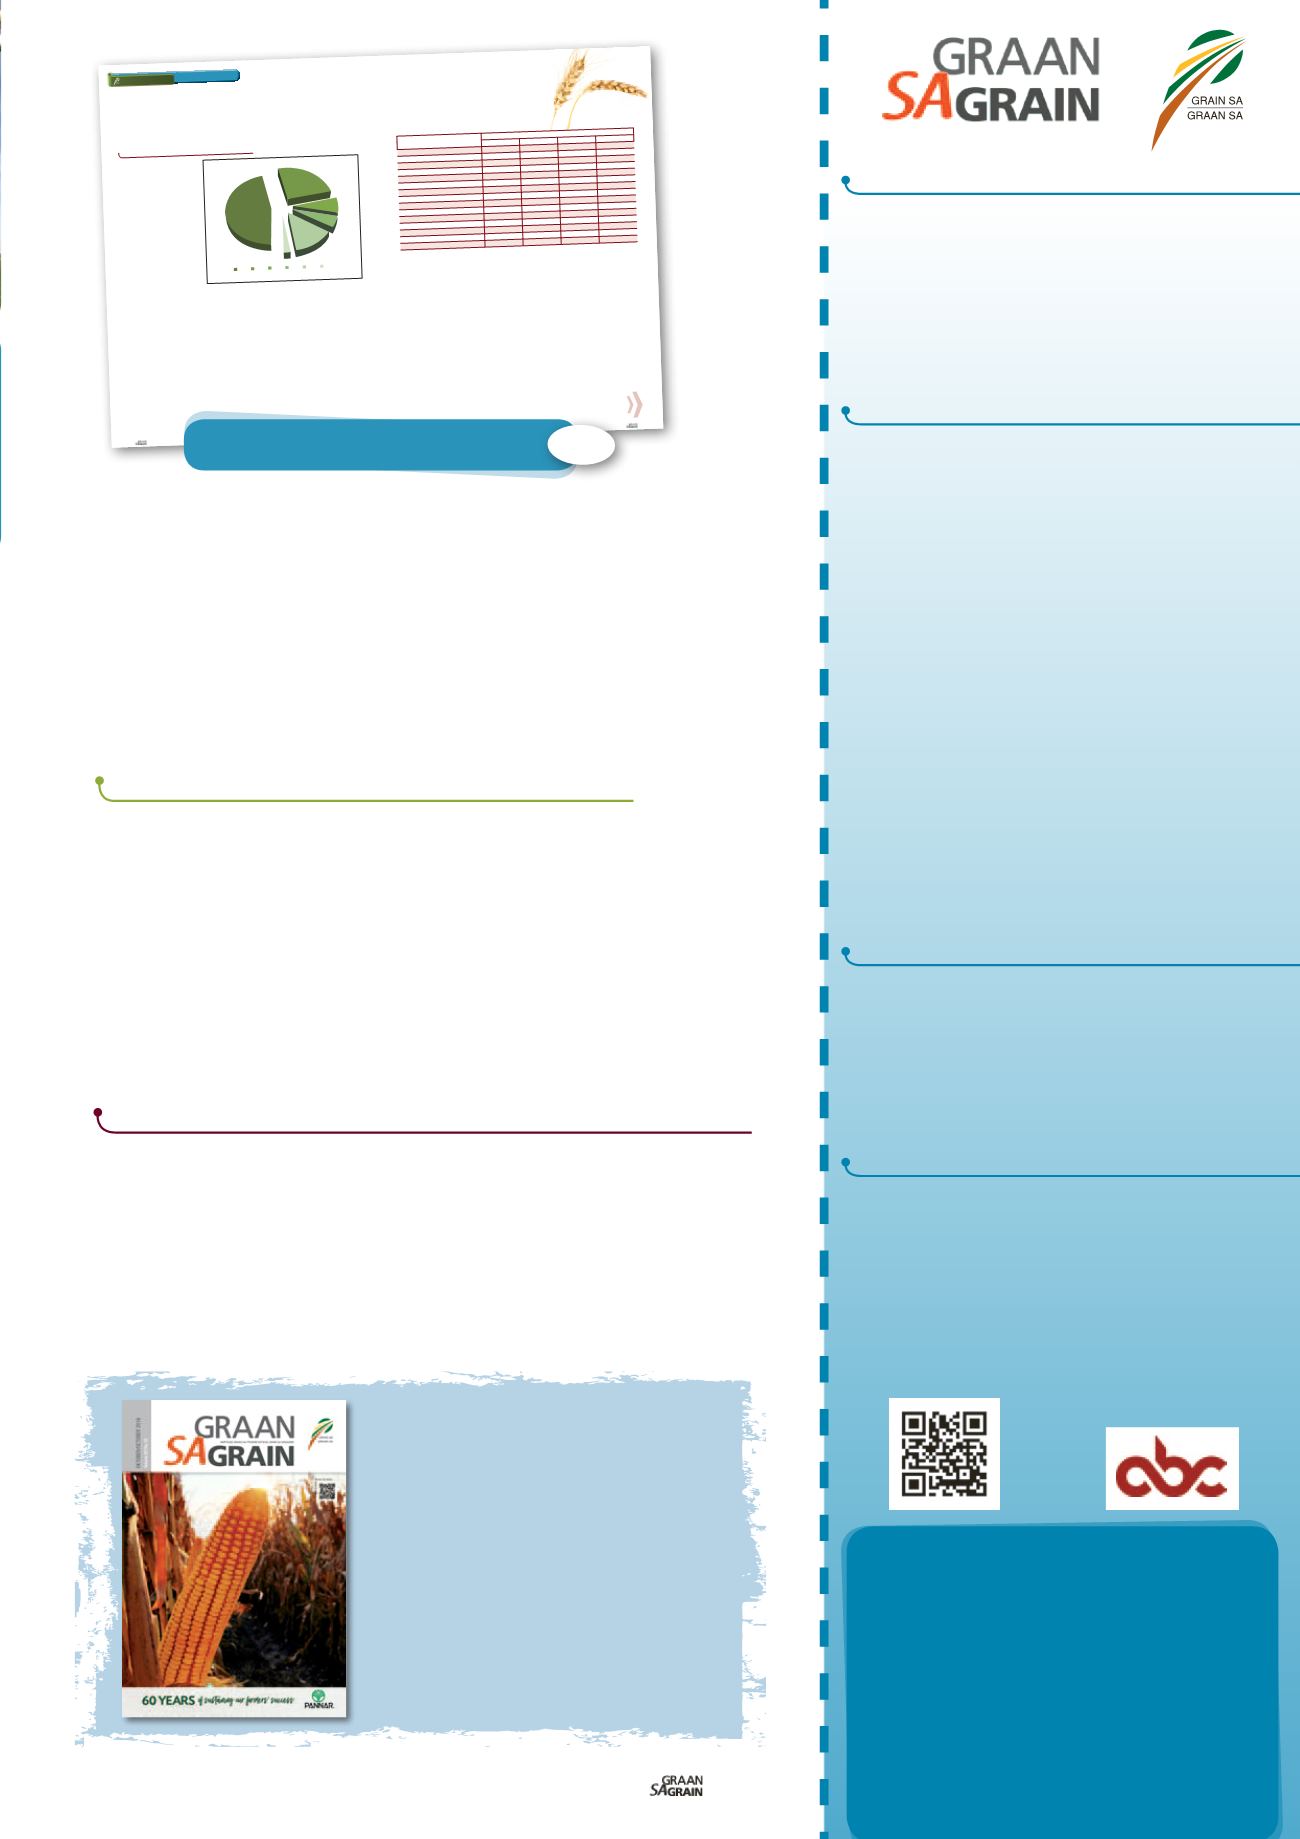
See
Graph 1
for the percentage of sam-
ples graded per class and grade during this
season.
The majority of the samples (71%) down-
graded to utility grade was as a result of
either the percentage screenings ormainly
other grain and unthreshed ears, individu-
ally, or in combination with the combined
deviations, exceeding themaximum allow-
able level forgradesB1 toB4.Mostof these
downgraded samples originated from the
WesternCape.
GradeB1wheat in the FreeState amounted
to 51% (71% in the previous season). In the
irrigation areas 43% (52% in the previous
season) of thewheatwas graded as B1 and
in theWesternCape 48%was graded asB1
(22% in theprevious season).
The national whole wheat protein average
increased from 12% in the previous season
to 12,6%. The ten-year national average is
11,9%. This is the second highest average
since the 2004/2005 season and can be at-
tributed to theaboveaverageproteinvalues
observed in the winter rainfall area of the
WesternCapewhere severe drought condi-
tionswere experienced.
The winter rainfall area reported its high-
est protein average of 13,2% since the
start of this annual survey 20 years ago.
The irrigation areas averaged 11,9% and
the production regions in the Free State
12,6%. The percentage of samples having
protein contentshigher than 12% increased
from 47,8% last season to 63,5%. During
the 2015/2016 season this percentage was
68,2%. The protein content is reported on
a 12%moisturebasis.
Nationally
the average hectolitre mass
was 80,7 kg/hl, slightly lower than the
81,5 kg/hlof the 2016/2017 season.This val-
ue also compares verywellwith the eight-
year weighted average of 80,6 kg/hl for
determinations done by means of
the
Kern 222 instrument.
Of the 31 samples that reported values be-
low the77 kg/hlminimum level forgradeB1
wheat, 26 originated in theWestern Cape
(as can be expected due to the drought),
while the remaining five samplesoriginated
in the Free State production regions. The
regional averages ranged from 79,1 kg/hl in
theWesternCape to 83,2 kg/hl in the irriga-
tion areas.
The 1 000 kernelmass, reported on a 13%
moisture basis, decreased from 38,6 g
last season to 37,7 g this season. The
2015/2016 season’s average was 36,8 g.
Averagesoverproductionareasvaried from
36,2 g in theWestern Cape to 39,6 g in the
irrigation areas.
The weighted average percentage screen-
ings obtained with a 1,8mm slotted sieve
was 1,51%, 0,35% lower than the previous
season and also the lowest value in thepast
five seasons.Thewinter rainfallarea report-
ed the highest average percentage, namely
1,79% and the irrigation areas the lowest of
1,05%. 28 of the 304 samples exceeded the
3%maximum permissible screenings level
for grade B3 and of these eleven exceed-
ed the 4% maximum permissible level for
gradeB4.Mostof these samplesoriginated
in theWesternCape.
This season the average fallingnumberwas
371 sec. Five of the samples analysed gave
falling number values below 250 sec and
of these, four were below 220 sec. All but
one of these samples originated in the Free
State area, the other sample in theWestern
Cape. The highest average falling number
value of 385 sec,was reported for the irri-
gation areas. The results of this, aswell as
previous surveys,provideevidence that low
falling number values are generally not a
problem experienced inSouthAfrica.
See
Table 1
for a comparison of the aver-
age quality results of local wheat over the
past four seasons. It is interesting to note
that the average values of the 2017/2018
and
2015/2016
seasons’
farinograph,
alveograph and extensograph results are
almost identical, while the 2016/2017 and
RELEVANT
JOLANDANORTJÉ,
manager: Laboratory,SouthernAfricanGrain LaboratoryNPC
Graph 1:Percentageof samplesper class andgrade in the 2017/2018 season.
97
October 2018
2014/2015 results are very similar. A de-
crease in the alveogram distensibility with
a resulting increase in theP/Lvalue, is indic-
ativeof amore elasticdough.TheP/L value
isobtainedbydividing the stabilityvalue (P)
by thedistensibility value (L).
Mycotoxins
Mycotoxins,
toxic chemical compounds
producedbymoulds,cancontaminatecom-
moditieseither in the fieldorduring storage
and are invisible, odourless and tasteless.
Mycotoxin production is foremost a food
safety issue, although the occurrence of
moulds can also lead to damage ranging
from rancidity, odour, flavour changes, loss
of nutrients and germ layer destruction re-
sulting in a reduction inquality.Mostmyco-
toxins are toxic in very low concentrations
so this requires sensitive and reliablemeth-
ods for theirdetection.
According to the Food and Agriculture Or-
ganization, food losses due to mycotoxin
contamination are estimated at 25% on a
global scale and pose a real threat to food
security, especially in Africa where the
magnitude of losses is difficult to estimate
because of a lack of information. Effective
management to prevent food losses or ad-
verse health effects as a result of long-term
exposure to contaminated food isonlypos-
sible when adequate reliable testing data
is available. Well-timed
interventions
in
the food and feed value chain can then be
basedon these testing results.
The accredited multi-mycotoxin assess-
ments included in the annual wheat crop
quality survey for the past eight seasons,
provide themost comprehensive overview
of the multi-mycotoxin risk in commercial
wheat produced and delivered to commer-
cial grain storage companies in South Af-
rica. 40wheat samples, randomly selected
to represent different regions as well as
grades, are analysed annually.
An absence of Aflatoxin B
1
, B
2
, G
1
, G
2
, Fu-
monisin B
1
, B
2
, B
3
, Ochratoxin A, Zearale-
none, T2-toxin and HT-2 toxin in thewheat
samples over the past seven seasonswere
confirmed in the 2017/2018 season. The
samples that did test positive for Deoxyni-
valenol (DON) residues this season, were
all well below national and international
maximum residue levels, aswas the case in
previous seasons. The average value of the
seven positive resultswas 202 μg/kg (ppb)
and the highest value obtained 570 μg/kg.
Last season, four samples tested positive
for DON residueswith an average value of
289 μg/kg (ppb), the highest value obtained
was 501 μg/kg.
Constant monitoring and continued re-
search on the prevention andmitigation of
mycotoxin contamination are necessary.
Application of good agricultural practices
and storage conditions aswell as effective
mycotoxin risk management programmes
are essential elements in preventing the
negative effectsofmycotoxins.
Production overview
The commercial wheat crop of the 2017/
2018 season was set at 1,535million tons,
which is375000 tons (19,6%) lower than the
previous season’s crop and also 16% lower
than the ten-year production average of
1 826 800 tons (2007/2008 to 2016/2017
seasons).A total areaof 491 600hawasuti-
lised forwheat production and the average
yieldwas 3,12 t/ha.
A severely drought strickenWestern Cape
produced 586 800 tons of wheat this sea-
son, contributing 38,2% of the total crop,
compared to the 57,5% of the previous
season. The Free State’swheat production
(336 000 tons) was the highest of the past
five seasons. This figurewas also the sec-
ond highest nationally. The irrigation ar-
eas of the Northern Cape, the third largest
wheat producing area this season, pro-
duced 311 650 tons, 45 650 tonsmore than
last season. The remainder of the wheat
was produced mainly
in Limpopo with
132 000 tons, representing an increase of
27%compared to the2016/2017 seasonand
NorthWest Province,where production in-
creasedby 20% to 83 700 tons.
QUALITYPARAMETER
SEASON
2017/2018
2016/2017
2015/2016
2014/2015
Flourprotein (12%mb),%
11,3
11,2
11,8
10,7
*KonicaMinolta colour, L*
93,78
93,71
93,78
93,77
*KonicaMinolta colour,b*
9,84
10,12
9,75
9,72
Wetgluten (14%mb),%
30,7
30,7
31,9
28,9
Drygluten (14%mb),%
10,4
10,5
11,0
9,8
Farinogram absorption (14%mb),%
60,3
60,1
60,8
59,5
Farinogramdevelopment time,min
5,5
5,2
5,8
5,3
Farinogram stability,min
8,0
8,3
8,0
8,3
Alveogram strength, cm
2
39,2
37,0
38,3
38,1
Alveogram stability,mm
83
73
81
75
Alveogramdistensibility,mm
115
135
115
133
AlveogramP/L
0,81
0,57
0,75
0,59
Extensogram strength, cm
2
106
99
105
98
Mixogrampeak time,min
2,6
2,6
2,6
2,7
Bread volume 100g, cm
3
1 096
1 040
1 047
889
*CIELAB L*a*b*
TABLE 1:AVERAGEQUALITYOF LOCALWHEATOVER FOURSEASONS.
14%
47%
B1
B2
B3
B4
UT
COW
25%
7%
5%
2%
Relevant
79
Produksiepotensiaal – ’n eenvoudige berekening
83
The who’s who of soil health
86
Conversion to no-tillage: Perspectives from Argentina
90
Voorkom dié foute met bewaringslandbou
93
Van geen- tot strookbewerking – spoedsonthalwe
aktueel
/
relevant
96
Local and imported wheat quality scrutinised
102 Grain SA/Sasol photo competition:
That’s not the image I wanted
104
Boer slim met tegnologiese toepassings
109
Landbouleiers voltooi bestuursprogram
110 Graantrusts ondersteun volhoubaarheid
Deel 1: Mielietrust
110
Topprys vir bul met sterk teelwaardes
rubrieke
/
features
4 Graan SA Standpunt:
Landbouplan: Wat kom eerste?
5 Grain SA Point of View:
Plan for agriculture: What comes first?
7 Uit die Woord
7 Op die kantlyn
112 E-posse:
Hoe kry ons die tandepasta terug in die buis?
96