


 72 / 84

Junie 2018
70
The
inefficient
producer?
T
he term ‘competitiveness’ is best
understood as the ability of a sec
tor, industry, firm or farm to com
pete by trading their products
within the global environment while at least
earning the opportunity cost of resources
employed. For wheat producers in South
Africa, the empirical indicators of competi
tiveness seemingly tell a depressing story
while, on the other hand, depicting wheat
millers as sufficiently competitive on global
standards.
However, the operating environment within
which value chain stakeholders operate
either incentivises their business activity or
disincentivises it. These operating incen
tives in turn play a large role in the specific
stakeholder’s ability to be competitive.
We are able to quantify these incentives and
disincentives through a ‘distortion’ meas
urement. This is done through comparisons
of ‘perfect world’ free market prices and pre
vailed market prices in the domestic market.
Through doing this, the degree to which the
policy and operating environment has dis
torted incentives for individual stakeholders
to operate in is able to be determined and
quantified.
Quantifying distortions
Positive distortions prevail where the price
received by the specific value chain stake
holder is higher than the price that they
would have otherwise received in a ‘perfect
world’ free market. Consequently, such a
situation is interpreted as the policy and op
erating environment ‘supporting’ the value
chain stakeholder as their business opera
tion is incentivised.
Where the price received is lower than the
‘perfect world’ price, negative distortions
prevail and the situation is interpreted as the
policy and operating environment ‘taxing’
or inhibiting the value chain stakeholder.
An empirical indicator known as the nominal
rate of assistance (NRA) is used to quantify
the magnitude of distortions. In broad terms,
the nominal rate of assistance indicates the
percentage by which gross incomes have
been raised or lowered from the level that
these incomes would otherwise have been
at in an intervention free (undistorted) oper
ating and policy environment.
These nominal rate of assistance distortion
indicators are able to be calculated for indi
vidual agents in a vertical value chain such
as producers, millers and consumers in or
der to quantify the degree to which each of
these agents’ operating activities are ‘sup
ported’ or ‘taxed’.
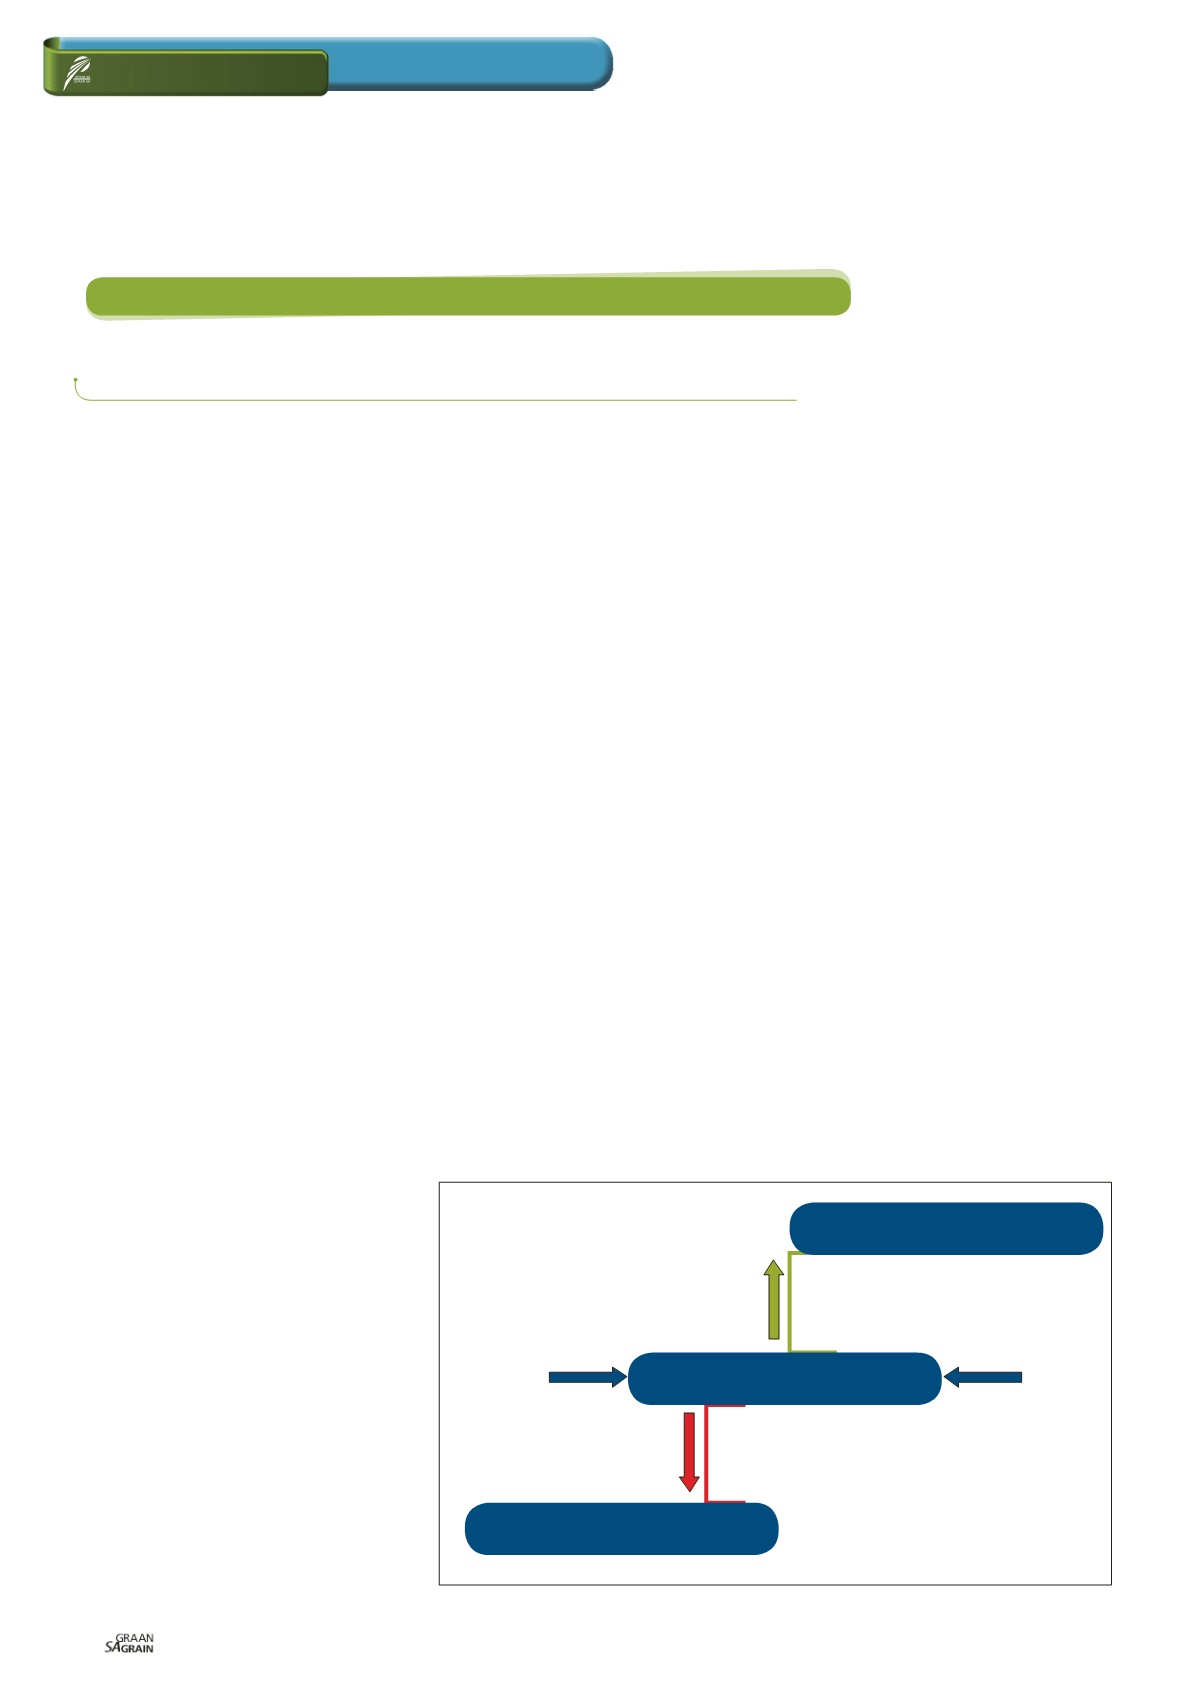
A positive nominal rate of assistance value
for a specific agent indicates a positive dis
tortion (‘supporting’ in
Figure 1
) whereas a
negative nominal rate of assistance value
indicates a negative distortion (‘taxing’ in
Figure 1).
Distortion values for the
wheat value chain
The distortion values for wheat producers,
millers and flour consumers are depicted in
Graph 1
. Clearly evident from the nominal
rate of assistance values is that over the
time period analysed, wheat millers enjoyed
the luxury of an operating and policy envi
ronment which provided tremendous sup
port towards their business operation.
On the other hand, wheat producers and
flour consumers were faced with an envi
ronment in which their existence and sur
vival was disincentivised or ‘taxed’.
An interesting trend in the distortion in
dicators is the decline of the nominal rate
of assistance to millers leading up to the
2007/2008 marketing year in which the
wheat flour cartel was exposed.
Over a five-year period between 2002/2003
and 2007/2008, wheat millers went from
receiving incomes 95% higher than they
would otherwise receive in a perfect collu
sion free market to receiving incomes just
4% higher than would be received in a per
fect market.
Thus, if the cartel bust marketing year of
2007/2008 is interpreted as a year with no
collusion present in the wheat milling in
dustry, the high positive nominal rate of as
sistance values prior to 2007/2008 can likely
be attributed to the collusion at processing
level which the cartel used to distort the in
centives throughout the wheat value chain.
In simple terms, through collusion, the
wheat milling industry was able to manipu
late the operating environment and policy
environment to the disfavour of all other
value chain agents, but in favour of the
wheat milling industry. This is re-iterated
in the negative nominal rate of assistance
in Graph 1 for wheat producers and wheat
flour consumers who throughout the stud
ied period found themselves being forced
to operate in an operating and policy envi
ronment which disincentivised their exist
ence and operation.
Relevant
Questioning the South African wheat value chain’s core competitiveness
Michael Day,
managing director, AfriValue Consulting; research conducted in fulfilment of MSc (Agric),
Agricultural Economics at Stellenbosch University
Price received
(production incentivised)
Free market price (perfect world)
Positive distortion
‘supporting’
Negative distortion
‘taxing’
Price received
(production disincentivised)
Figure 1: Illustration of a price distortion.