


 71 / 84

Improved germplasm
MAS/MAB is an imperative and integral part of this project since
markers are able to confirm if targeted resistance QTL/genes are
present, just a few weeks after germination, compared to more con
ventional methods, which can take up to five to six months.
The developed material is planted in the field for Fusarium head
blight resistance validation and general performance evaluation. In
the next few years, these combinations will potentially contain four
to five Fusarium head blight scab resistance genes/QTL stacked
from different Fusarium head blight resistance sources. Significant
progress on germplasm development has already been made with
Fusarium head blight/scab resistant entries and nurseries released
annually from 2015, as this pre-breeding programme is a publicly
funded project (Photo 3).
In South Africa, Fusarium head blight/scab research needs the
commitment from both the wheat and barley industries on a selected
organisation/service provider for the accurate, unbiased, reliable,
phenotypic evaluation of Fusarium head blight resistance. In addi
tion, a shift in focus on monitoring mycotoxin presence in seed lots
is called for. This information can then be used in the final recom
mendations and classification of released cultivars.
It will greatly assist the South African wheat and barley produc
ers to make better and more informed decisions on scab/Fusarium
head blight disease associated risks on their farms. Ultimately, this
integrated pre-breeding Fusarium head blight programme will de
velop higher-yielding scab/Fusarium head blight and mycotoxin
resistant germplasm to the benefit of the South African wheat/
barley producer.
The ARC-Small Grain in Bethlehem is available for more information.
Contact Cathy de Villiers or Dr Scott Sydenham at
058 307 3400,
devilliersc@arc.agric.za
or
syden-
hams@arc.agric.za
.
3
3: The glasshouse in which backcrosses and topcrosses are made.
69
June 2018
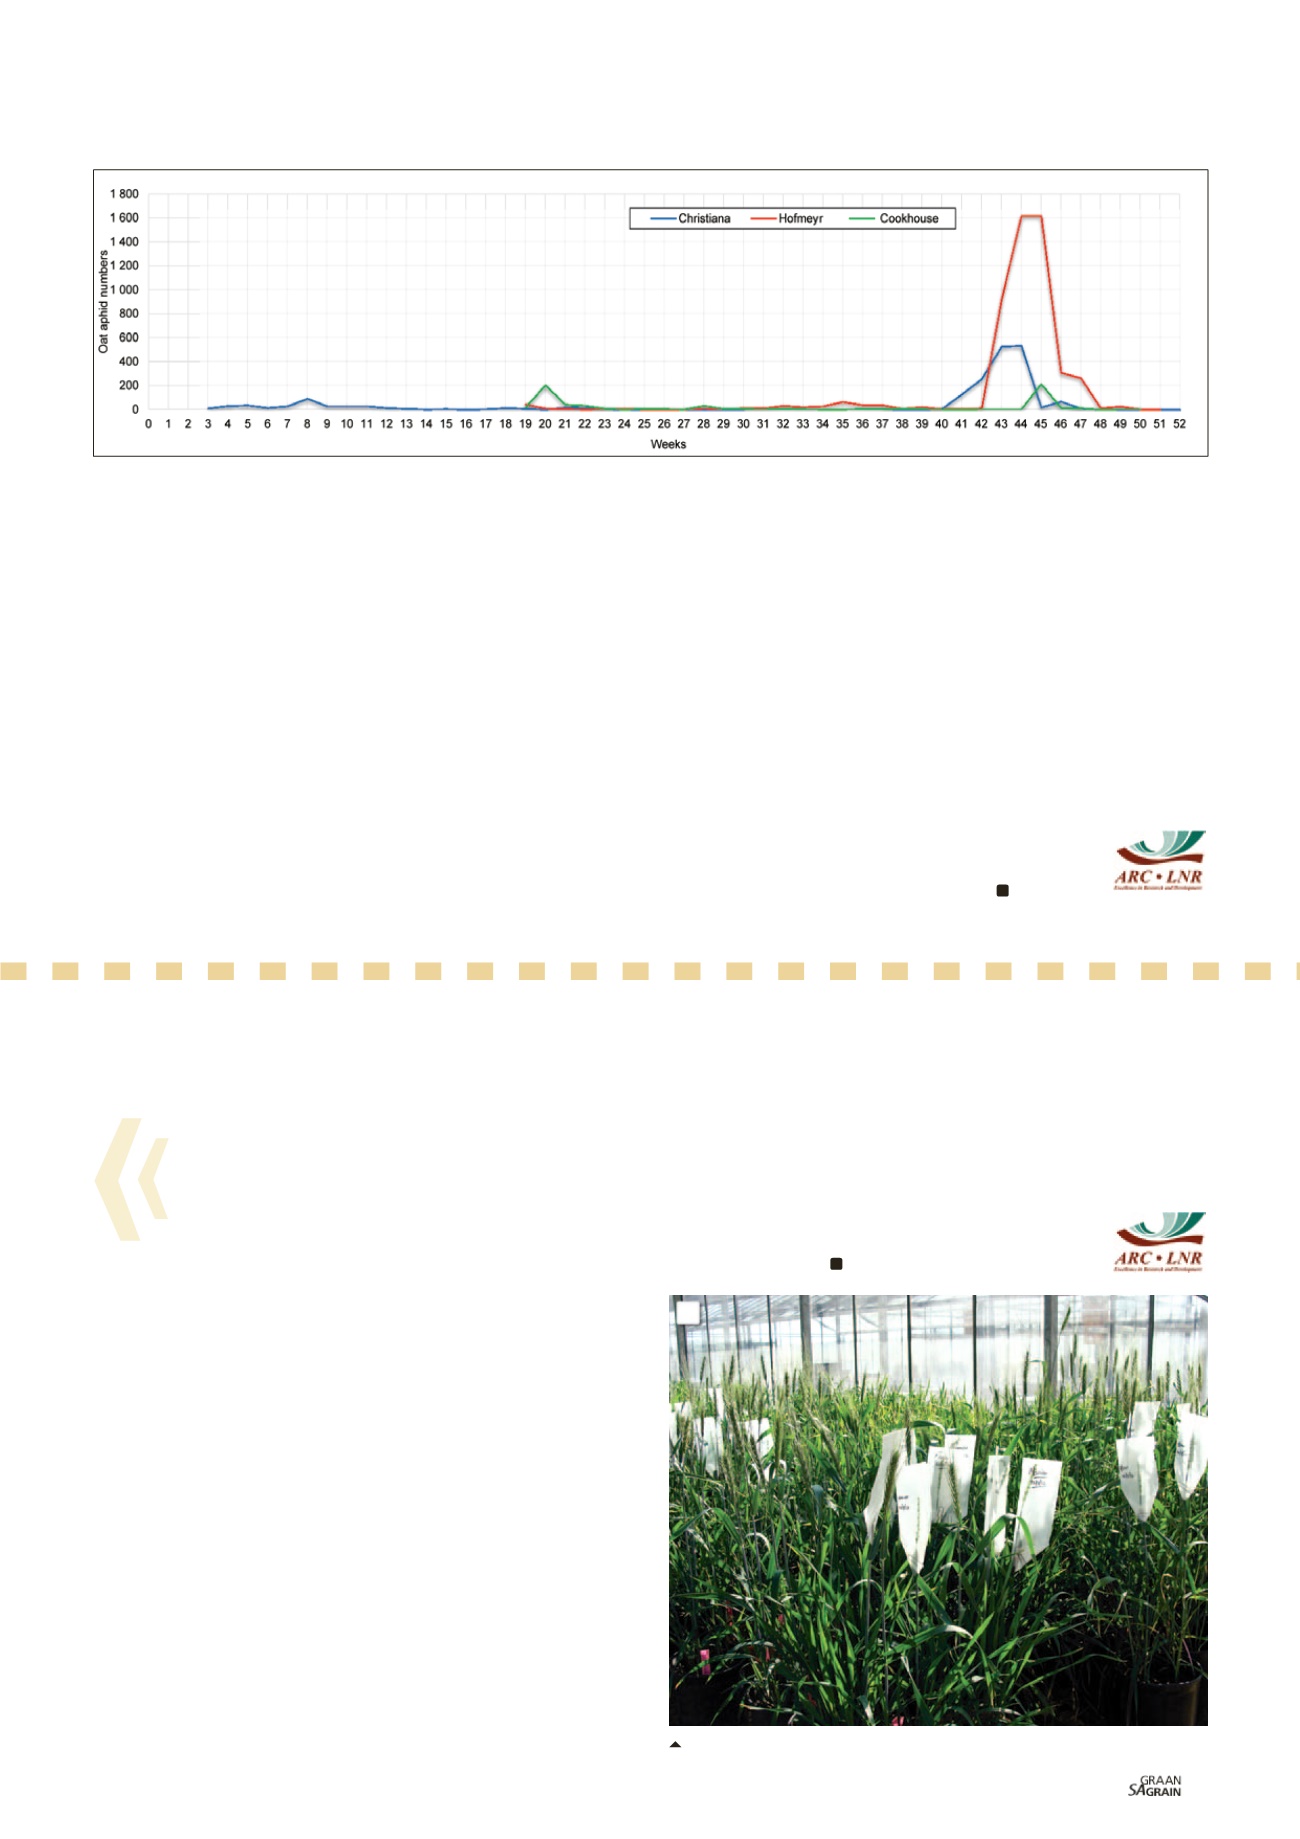
Graph 1: Oat aphid numbers from suction traps at Christiana, Hofmeyr and Cookhouse.
If we look at the aphid number peaks in the different areas there
seem to be coincidences between traps. For example, from mid-
October last year (week 41 to week 44), an oat aphid peak was ob
served in the Christiana trap (
Graph 1
).
The small trap in Hofmeyr showed a huge peak which overlaps with
this period (week 43 to week 45), while the Cookhouse trap reveals a
peak during week 45.
Producers in the Eastern Cape were cutting their oats during this
period for silage purposes, which forced many aphids from the crop
and locally moving aphids are easily trapped by the small trap.
A detailed look at air current patterns during this period revealed
a possible explanation for these aphid numbers to peak at almost
the same time. During the week of 15 November last year, air cur
rents were heading from the south inland over the country in a
slight north-western direction passing over Hofmeyr (
Figure 1
).
In the Orange River region of the Northern Cape, these currents
made an almost 90° turn in an easterly direction, heading all the way
over the Kimberley, Christiana and Vaalharts areas (Figure 1). Wind
speed at that time was 40 km/h to 60 km/h, which may have carried
aphids within a day to the Christiana area.
However, since air currents change every day, the opposite could
also be true, carrying aphids to different production areas in short
times and thus enabling the spread of plant viruses between regions.
For a better understanding and forecasting of aphid migration, the
physical on-farm activities and air current patterns should also be
considered in the analysis of aphid flight data.
For further information contact Dr Goddy Prinsloo at
prinsloogj@arc.agric.za
or 082 875 3401.