


 74 / 84

Junie 2018
72
Relevant
Indemnity
The opinions expressed in this magazine are those of the contributors and do not necessarily reflect the official opinion of Grain SA.
The
inefficient
producer?
Therefore, it is necessary to question the
core competitiveness abilities, given spe
cific proxies of wheat producers and millers
were they to be operating in an undistorted
environment (NRA = 0) free of collusion.
Implications: A worrying
trend
The high nominal rate of assistance and
high relative trade advantage values during
the years leading up to 2007/2008 are able to
be understood with the historic knowledge
of the active wheat milling cartel which was
able to manipulate the value chain operating
environment in its favour.
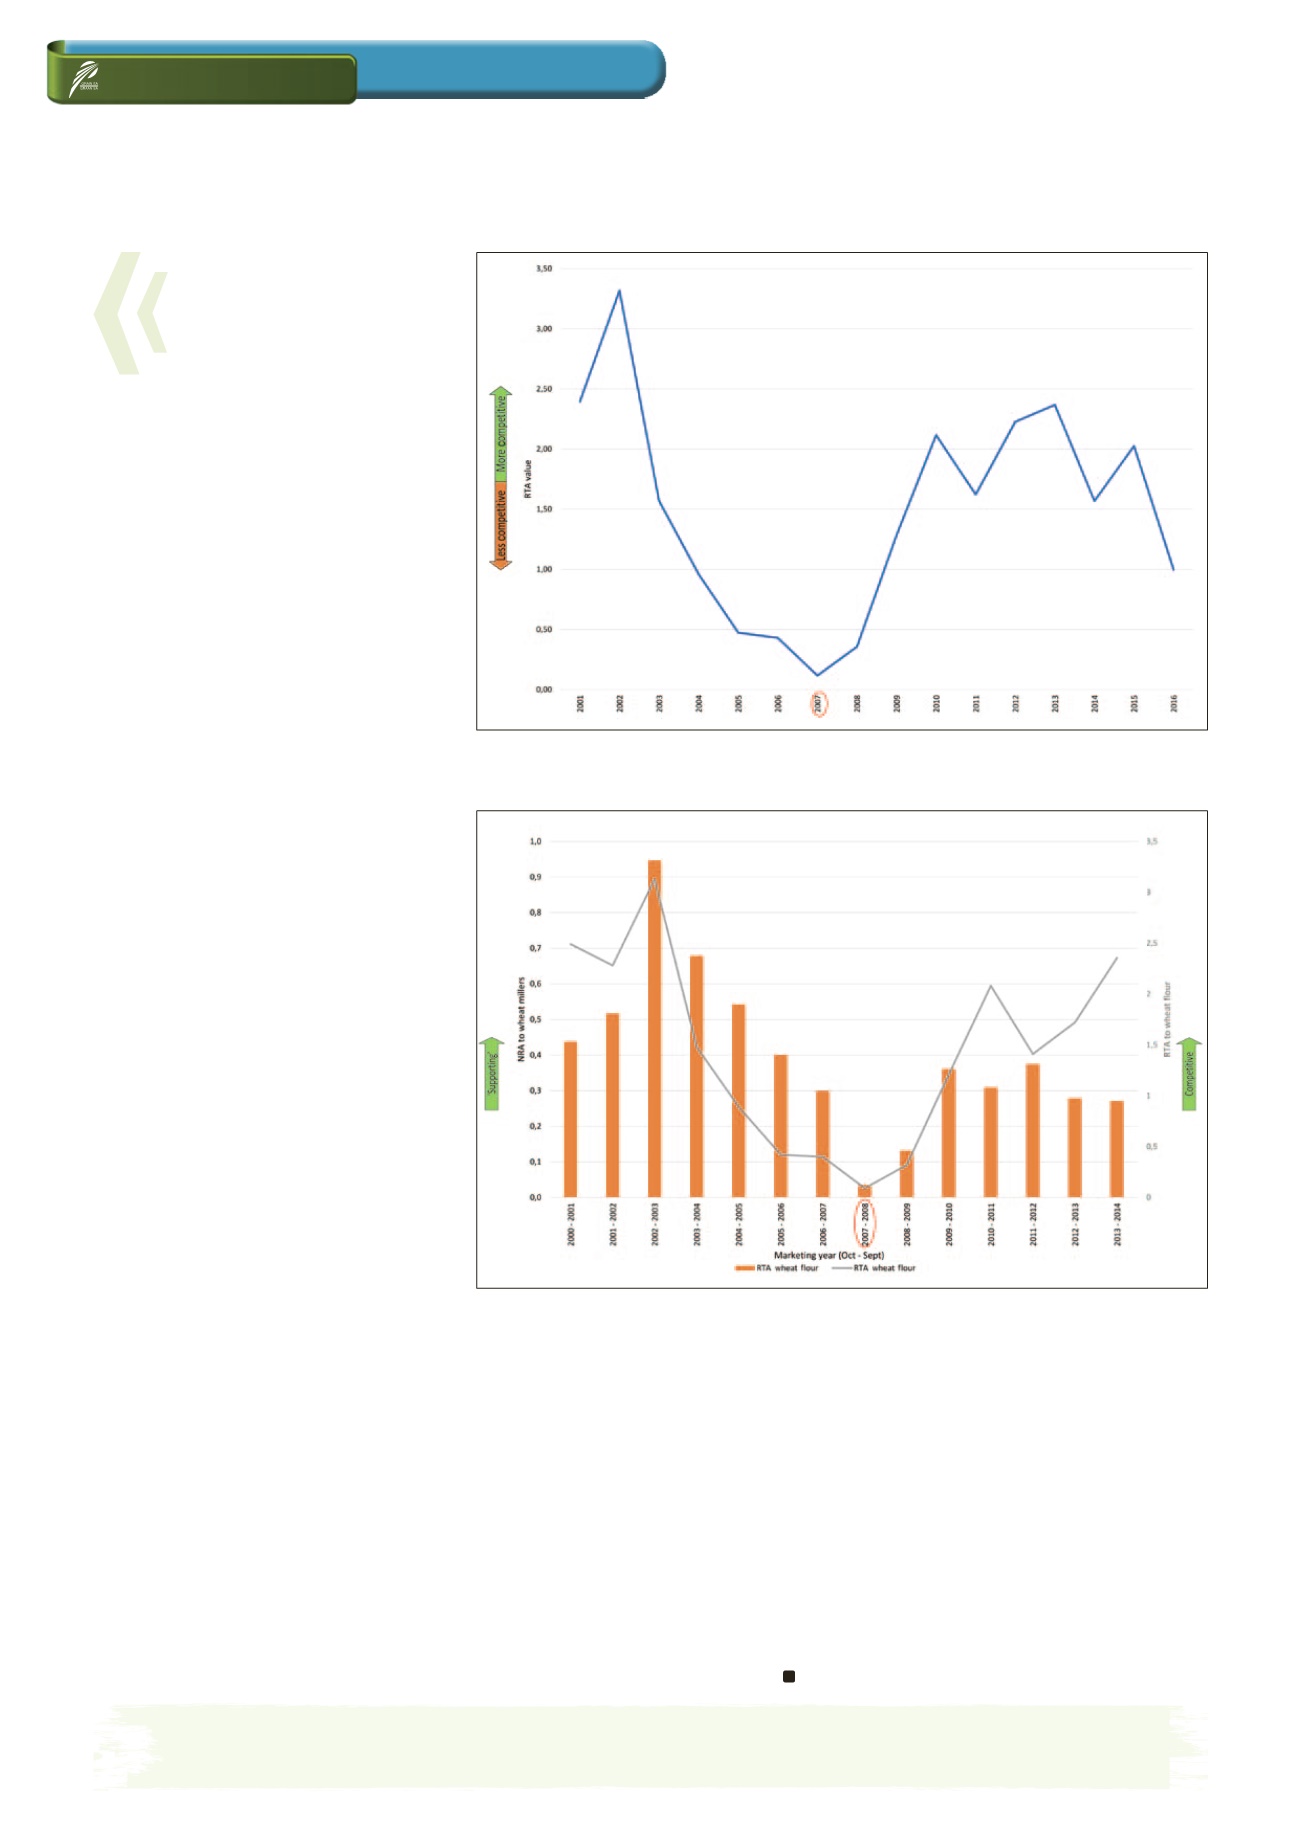
However, Graph 4 depicts how these com
petitiveness and distortion indicators for
wheat millers once again rose to similar lev
els as those seen during active cartel years
even beyond the 2007/2008 marketing year.
This questions the transparency of the mill
ing industry in its current state as well as
the regulations governing the wheat mill
ing industry post cartel bust. It furthermore
necessitates analysis in order to determine
why, in a supposedly free market, wheat
millers are still able to distort the incentives
in the value chain.
From Graph 1, it is clearly evident that the
manipulation of the value chain’s policy and
operating environment post cartel bust is
once again to the detriment of wheat pro
ducers and wheat flour consumers and in
favour of wheat millers.
From a producer’s perspective, it is ex
tremely difficult to improve competi
tiveness in an unconducive operating
environment where producers remain price
takers. (The difficulty to integrate vertically
in the value chain due to high barriers to
entry with regards to operating capital and
financing intensifies this challenging operat
ing environment.)
This while consumers of wheat flour are
forced to pay prices well above the would
be free market equilibrium price and in
crease the inefficient share of value adding
occurring at wheat processing level.
If the wheat sector sits back and accepts
that wheat producers are not competitive
and inefficient without probing why non-
competitiveness is observed, the South
African wheat value chain will grow in inef
ficiency as the big elephants of the wheat
value chain continue to manipulate and
self-regulate the incentives throughout the
chain.
It is well overdue to question the core com
petitiveness of the key wheat value chain
stakeholders and their perceived respec
tive (in)efficiencies. Deeper analysis of the
interaction of distortion indicators, compe
titiveness indicators and their link to
anti-competitive behaviour is needed to de
termine whether it is indeed a case of the
‘inefficient producer’ as opposed to a more
likely case of the ‘inefficient value chain’.
For more information contact Michael Day
at
michael@afrivalueconsulting.co.za
.
Source
Source of relative trade advantage competitiveness
indicator data: Boonzaaier, JDTL. 2017.
South African
wheat industry relative trade advantage data
to Day, MRB [Online], 28 August 2017.
Grain SA. 2017. Grain SA Market Report. Available:
http://www.grainsa.co.za/pages/industry-reports/
market-reports
(accessed 05 May 2017).
SAGIS (South African Grain Information Service).
2017. South African Grain Information Service In
formation/Data. Available:
http://www.sagis.org.za/
index.html
(accessed 04 August 2017).
Van Rooyen, CJ. 2008.
The competitiveness of the
South African agribusiness sector, 2008
. University
of Pretoria: Pretoria.
Graph 3: Nominal rate of assistance competitiveness indicator for wheat flour milling.
Source of relative trade advantage competitiveness indicator data: Boonzaaier, JDTL
Graph 4: Nominal rate of assistance to wheat millers and relative trade advantage of wheat flour,
South Africa, marketing years 2000/2001 to 2013/2014.
RTA = relative trade advantage
Source of relative trade advantage competitiveness indicator data: Boonzaaier, JDTL