


 73 / 84

71
June 2018
Competitiveness and
distortions
As alluded to in the introductory comments
of this article, a value chain stakeholder’s
competitiveness can be seen as a function
of the operating and policy environment in
which the specific stakeholder operates.
Empirically quantifying distortions enables
us to measure the incentives or disincen
tives facing individual value chain agents
and thus begin to answer the question re
garding why some value chain stakeholders
are deemed to be more competitive than
others.
The relative trade advantage (RTA) is an in
dicator or proxy of competitiveness where
positive relative trade advantage values re
flect competitiveness and negative relative
trade advantage values reflect non-compet
itiveness. (The relative trade advantage is
a measure of overall industry competitive
ness and should not be confused with farm
level profitability. Thus, a negative relative
trade advantage does not imply that every
wheat farm in South Africa is operating at
a loss.)
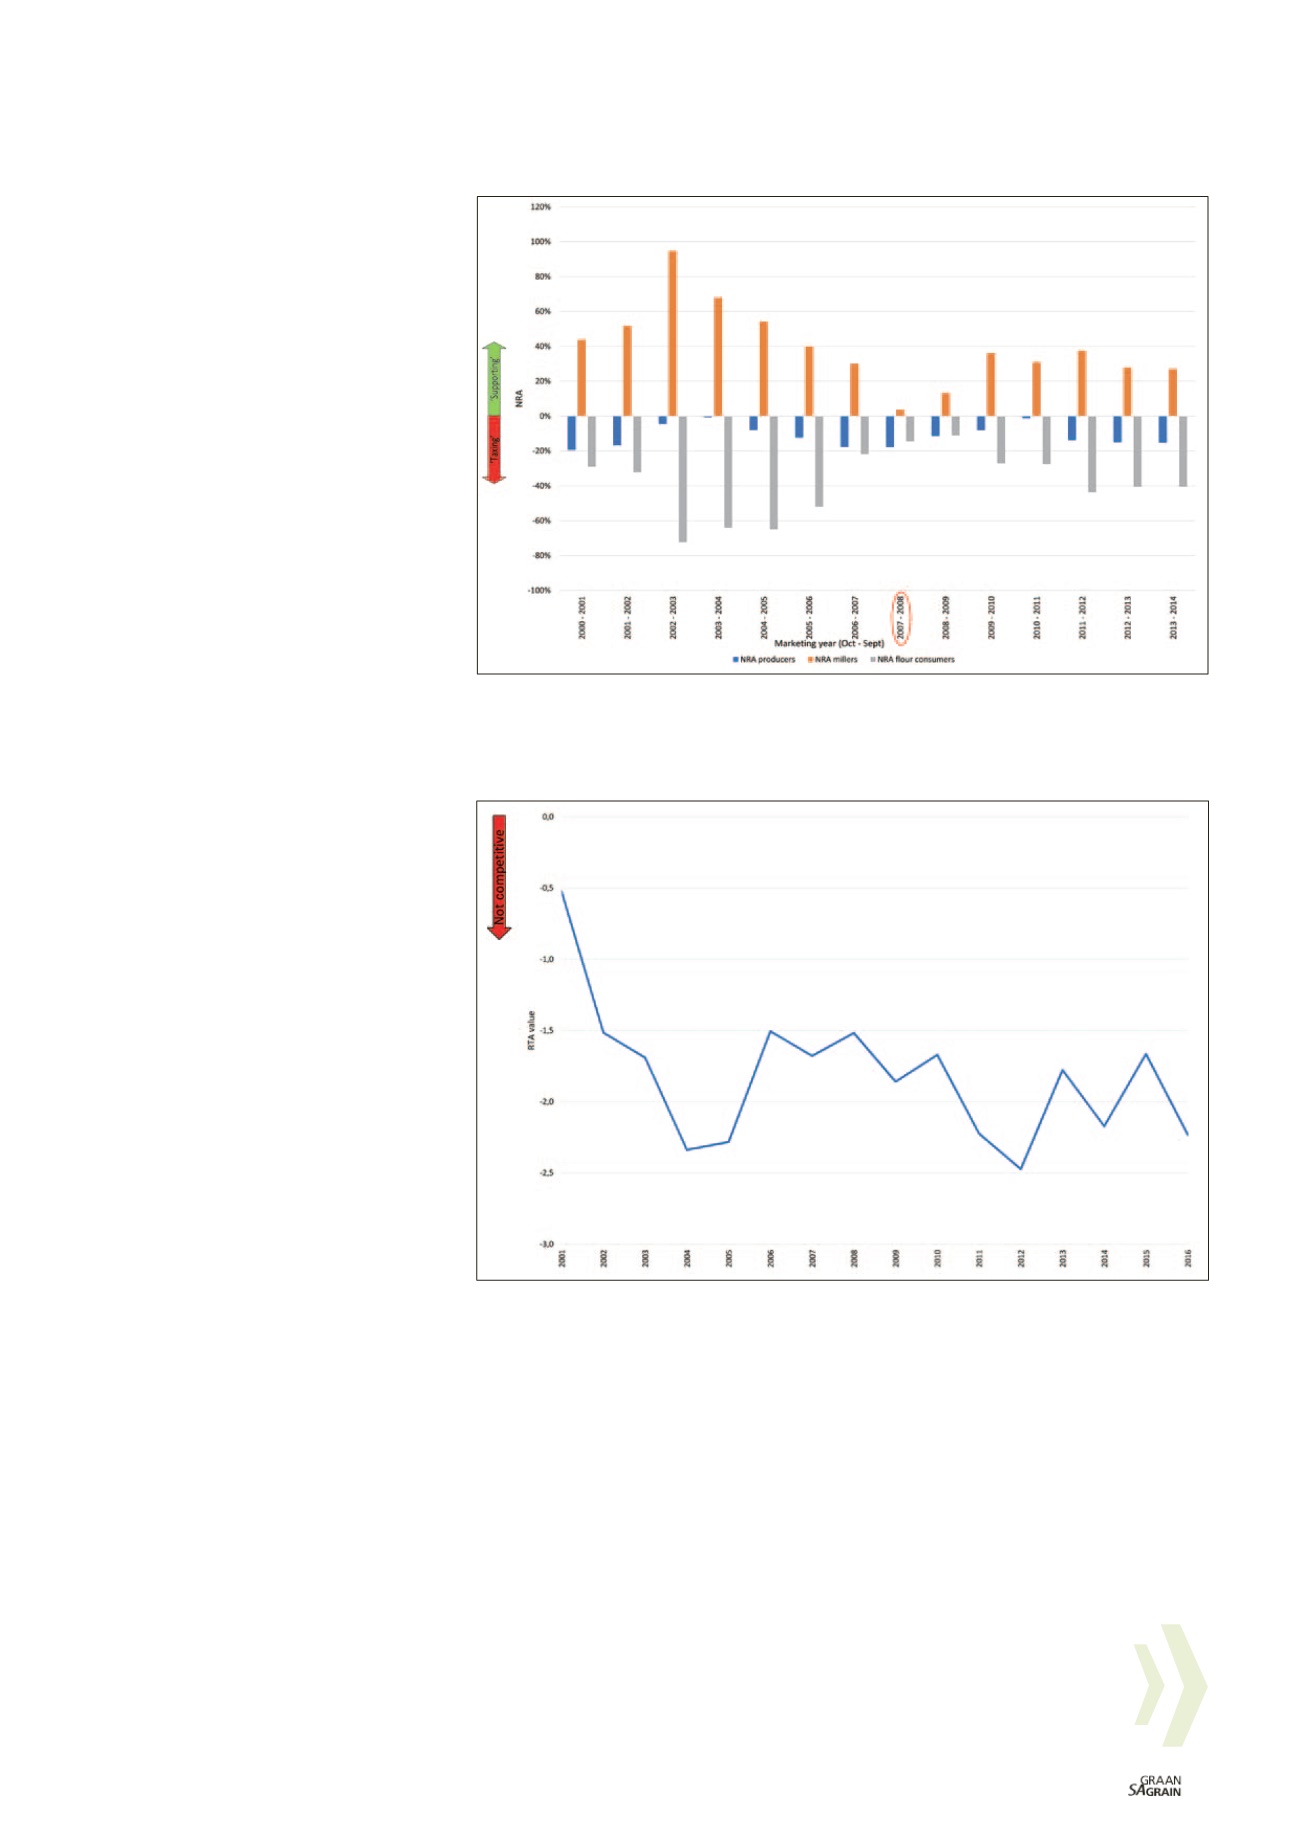
Graph 2
and
Graph 3
illustrate the non-
competitiveness of wheat producers and
the competitiveness of wheat millers re
spectively.
If one focuses on the distortions facing
wheat producers and millers in conjunc
tion with their perceived competitiveness,
we are able to progress past simply stating
whether a specific value chain stakeholder
is competitive or not and propose reasons
why we observe certain competitiveness
levels amongst value chain stakeholders.
For wheat producers, their non-competitive
ness (Graph 2) was experienced while they
operated in an environment disincentivising
their existence (Graph 1). It is therefore no
surprise that wheat producers were unable
to increase their competitiveness under
such a ‘taxing’ operating environment.
The link between wheat millers’ competi
tiveness and distortion indicators exhibit a
concerning trend. When we compare wheat
millers’ nominal rate of assistance indica
tors and relative trade advantage indicators
it becomes evident that during years of per
ceived high competitiveness (high positive
relative trade advantages), large positive
distortions (nominal rate of assistances)
were also present.
Both these large positive distortions as well
as wheat millers’ competitiveness declined
to near zero during the cartel bust year of
2007/2008. The distortion and competitive
ness indicators are contained in
Graph 4
.
From the analysis of wheat millers’ competi
tiveness and distortions, it is plausible to
propose that a possible reason why wheat
millers were deemed to be competitive dur
ing the cartel years was because they were
able to manipulate the entire wheat value
chain’s operating and policy environment in
their favour.
As the market power strength of the
wheat flour cartel decreased leading up to
2007/2008, so did the ability of the wheat
millers to distort the value chain incentives
in their favour. This resulted in wheat mill
ers being deemed to be less competitive
because they were being forced to operate
in a freer market without collusion.
The cartel bust year of 2007/2008 can pos
sibly be considered as the closest that
the wheat value chain has come to a per
fectly free market due to the competition
commission’s investigation of the industry.
During this marketing period, wheat mill
ers were operating in a marginally distort
ed market (such a small distortion can be
deemed negligible) and their competitive
ness was near zero, indicating marginal
competitiveness.
This evidence re-enforces the prior suspi
cion that a large reason for wheat millers’
perceived competitiveness was because
they were distorting the value chain operat
ing environment in their favour.
Graph 1: Nominal rate of assistance per selected agent in the wheat value chain – marketing years,
South Africa, 2000/2001 to 2013/2014.
NRA = nominal rate of assistance
Source of input data for calculations: Department of Agriculture, Forestry and Fisheries (DAFF). (2016).
Abstract of Agricultural Statistics.
DAFF: Pretoria, South Africa
Graph 2: Nominal rate of assistance competitiveness indicator for wheat production.
RTA = relative trade advantage
Source of relative trade advantage competitiveness indicator data: Boonzaaier, JDTL