
93
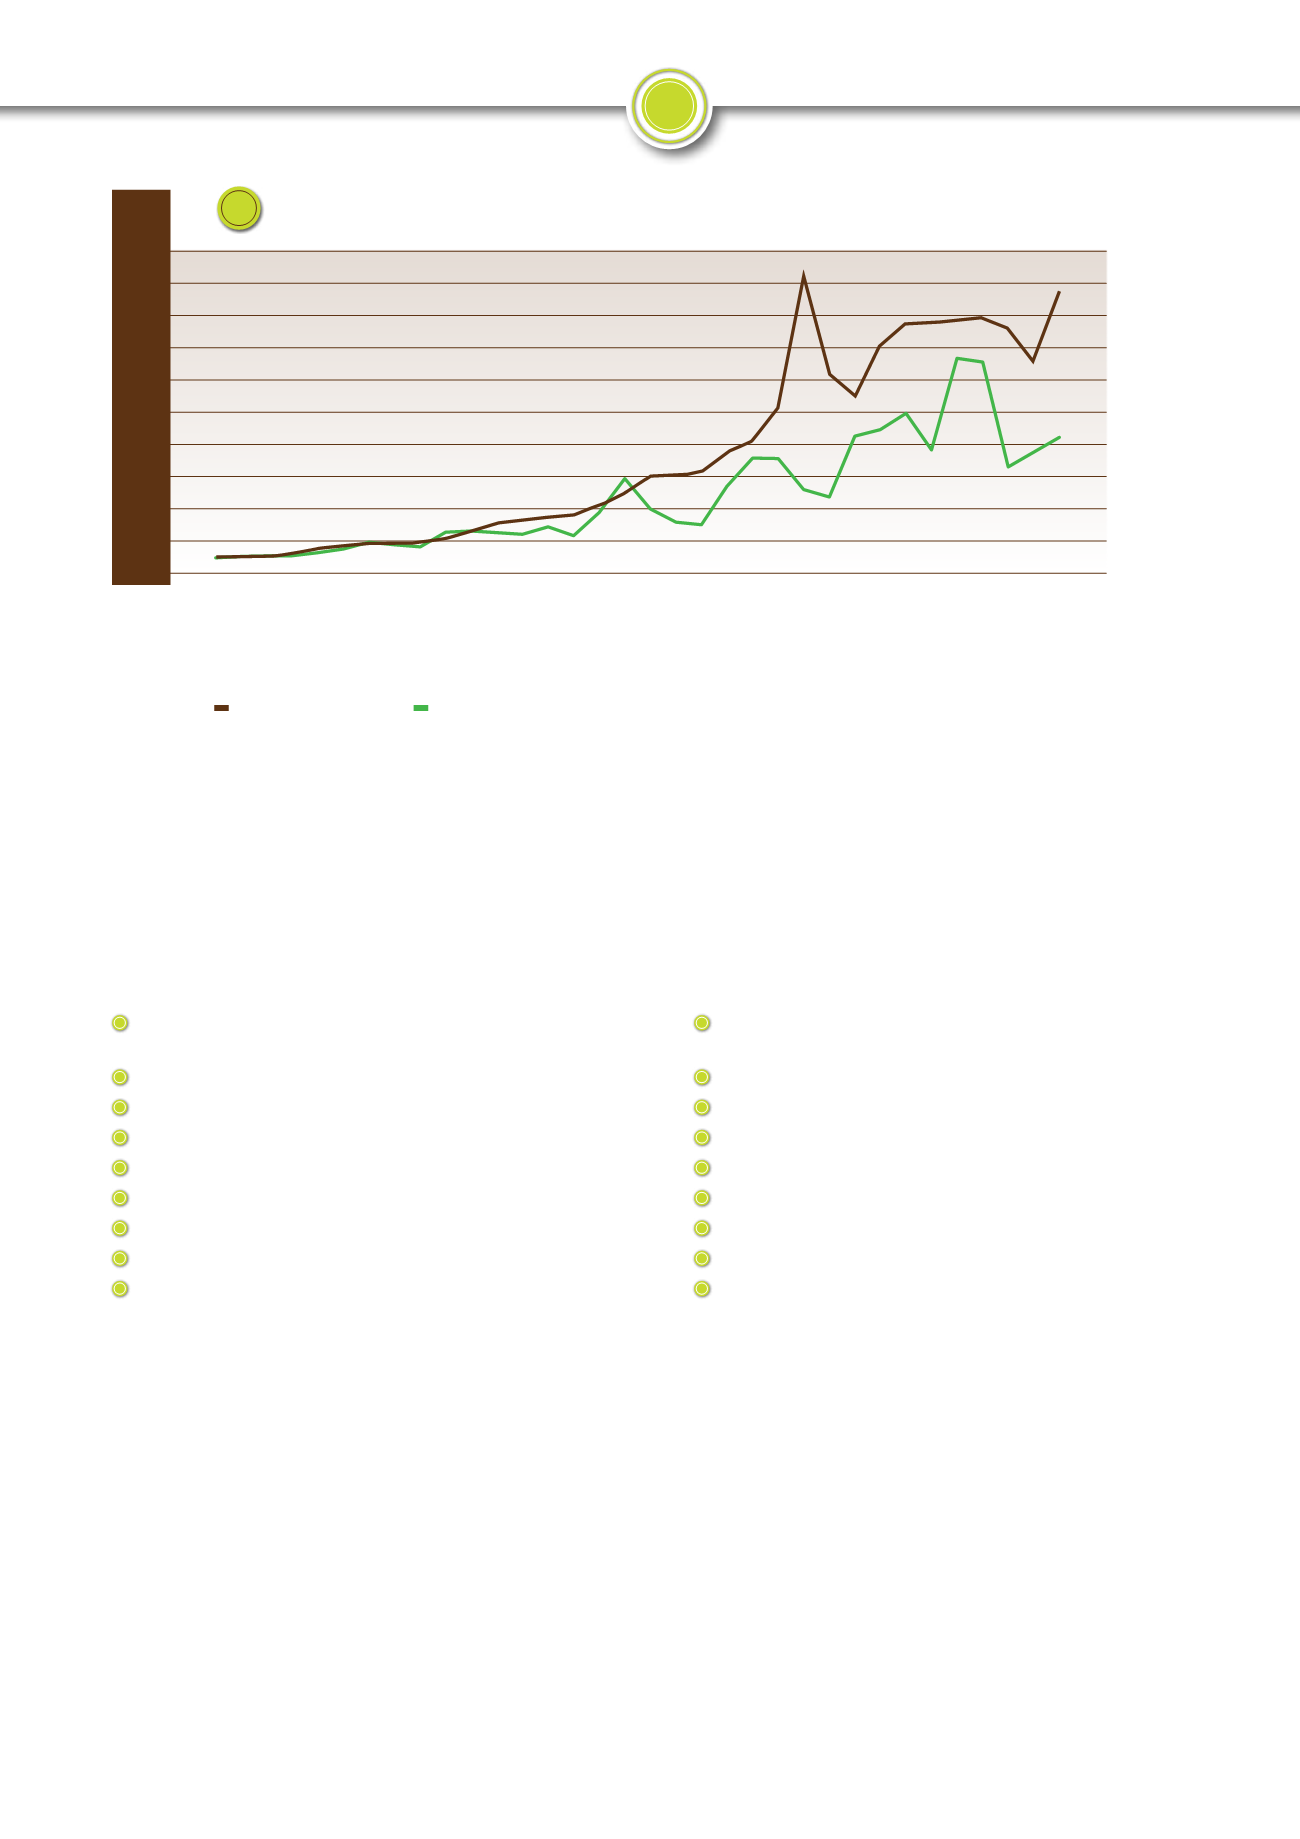
geraamde gemiddelde produsenteprys
2
van R1 984/ton vir die
komende produksieseisoen (2018/2019), styg die kunsmisprysindeks
skerper as die mielieprysindeks. Die gaping tussen die twee indekse
het dus verder vergroot.
JAARLIKSE VERGADERING MET FERTASA
Die jaarlikse vergadering tussen Graan SA en die Kunsmisvereniging
van Suider-Afrika (Fertasa) het op 26 Julie 2018 plaasgevind.
Belangrike sake wat tydens die vergadering bespreek is, sluit in:
Marktendense in die graanbedryf en produksiekoste vir die
2018/2019-produksieseisoen.
Kunsmiskoste en volhoubare graanproduksie teen uitvoerpariteit.
Internasionale en plaaslike situasie in die kunsmisbedryf.
Die beskikbaarheid van kunsmis en vervoerlogistiek.
Tendense in die kalkbedryf.
SA se afhanklikheid van invoere.
Die kunsmis- en kalkmoniteringsprojek.
Kunsmiswetsontwerp.
Situasie by Foskor.
Landbouchemikalieëbedryf
PRYSE
Bykans 100% van die aktiewe bestanddele wat nodig is om plaaslike
landbouchemikalieë te vervaardig, word na Suid-Afrika ingevoer. Die
internasionale pryse en wisselkoers word dus versigtig gemoniteer,
aangesien dit ’n belangrike rol in plaaslike prystendense speel.
Tabel 4
(op bladsy 94) toon die internasionale pryse van die
aktiewe bestanddele van onkruiddoders wat by mielies gebruik word.
Die pryse is in dollar- sowel as in rand-terme.
Buiten vir metolachloor toon internasionale onkruiddoderprysten-
dense jaar-tot-jaar-stygings. Vanaf September 2017 tot September 2018
het die internasionale pryse van glifosaat met 4,8% gestyg, terwyl
asetochloor, atrasien en trifluralien ook toenames van 14,4%, 7,8% en
7,4% onderskeidelik toon. Metolachloor was die uitsondering en het met
4,5% gedaal. In dieselfde tydperk het die R/$-wisselkoers met 12,2%
Indices of the producer price of maize and the prices of fertiliser
Indeks van die produsenteprys van mielies en die prys van kunsmis
* Preliminary/Voorlopig
Index/Indeks: 1985/1986 = 100
1985/1986
1986/1987
1987/1988
1988/1989
1989/1990
1990/1991
1991/1992
1992/1993
1993/1994
1994/1995
1995/1996
1996/1997
1997/1998
1998/1999
1999/2000
2000/2001
2001/2002
2002/2003
2003/2004
2004/2005
2005/2006
2006/2007
2007/2008
2008/2009
2009/2010
2010/2011
2011/2012
2012/2013
2013/2014
2014/2015
2015/2016
2016/2017
2017/2018*
2018/2019*
Fertiliser price index
Kunsmisprysindeks
Maize price index
Mielieprysindeks
4
Index
Indeks
Source: Grain SA
Bron: Graan SA
2
Average producer price = Safex, July 2018 price - average differential cost - handling costs
2
Gemiddelde produsenteprys = Safex, Julie 2018-prys - gemiddelde differensiële koste - hanteringskoste
average producer price
2
of R1 984/ton for the coming production
season (2018/2019), the fertiliser price index is rising more sharply
than the maize price index. Therefore, the gap between the two indices
has widened further.
ANNUAL MEETING WITH FERTASA
The annual meeting between Grain SA and the Fertiliser Association
of Southern Africa (Fertasa) took place on 26 July 2018.
Important matters discussed at the meeting include:
Market trends in the grain and oilseed industry and production
costs for the 2018/2019 production season.
Fertiliser costs and sustainable grain production against export parity.
International and local situation in the fertiliser industry.
The availability of fertiliser and transport logistics.
Lime industry trends.
SA’s dependence on imports.
The fertiliser and lime monitoring project.
Fertiliser Bill.
Situation at Foskor.
Agrochemical industry
PRICES
Almost 100% of the active ingredients required to manufacture
local agricultural chemicals are imported to South Africa. Therefore,
the international prices and exchange rate are carefully monitored as
these play an important role in domestic price trends.
Table 4
(on page 94) shows the international prices of the active
ingredients of five herbicides used in maize. The prices are in both
dollar terms and rand terms.
Except for metolachlor, international herbicide price trends show
increases year-on-year. From September 2017 to September 2018,
international prices of glyphosate increased by 4,8%, while acetochlor,
atrazine and trifluralin also indicated increases of 14,4%, 7,8% and
7,4%, respectively. Metolachlor was the exception, decreasing by
4,5%. In the same period, the R/$ exchange rate weakened by 12,2%.
Inset- en produksie-oorsig
Input and production overview
Insetoorsig
Input overview
2 000
1 800
1 600
1 400
1 200
1 000
800
600
400
200
0


