


 48 / 116

46
Gekarteerde landerye toon die projek se voetspoor in elke ontwik-
kelingstreek. Die volgende kaarte toon die getal boere en beklemtoon
die afgeleë ligging van sommige projekte:
Mapped lands track the project footprint in each development region.
The following maps reflect the numbers of farmers and highlight the
remoteness of some operations:
Plaaswerkers
799
Kontrakteurs
53
Interns
17
Farm workers
799
Contractors
53
Interns
17
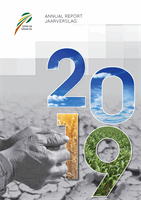
Dundee regional development office ă 759 farmers
Dundee-streeksontwikkelingskantoor ă 759 boere
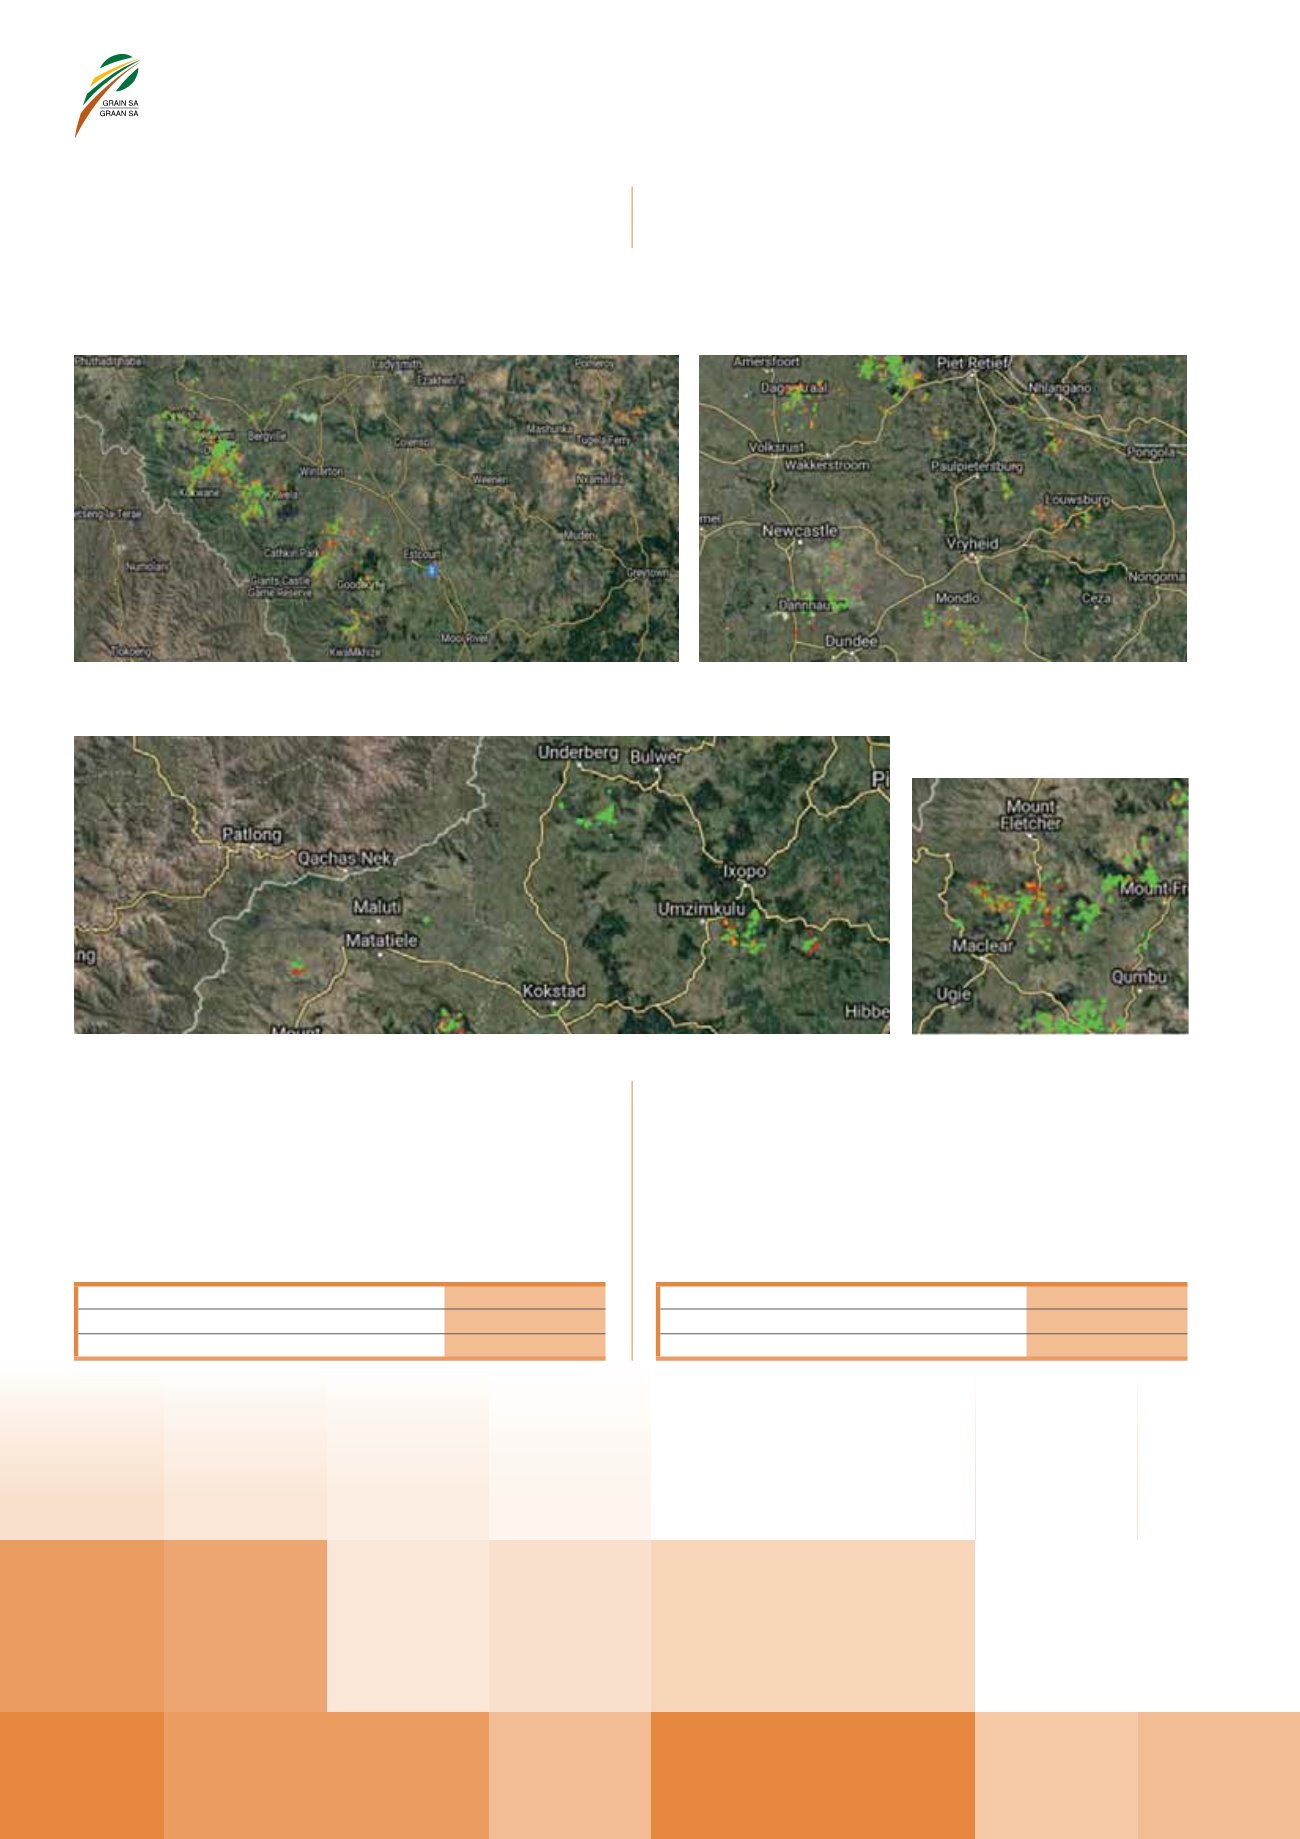
Kokstad regional development office ă 1 289 farmers
Kokstad-streeksontwikkelingskantoor ă 1 289 boere
Louwsburg regional development office ă 577 farmers
Louwsburg-streeksontwikkelingskantoor ă 577 boere
Maclear regional development office
ă 198 farmers
Maclear-streeksontwikkelingskantoor
ă 198 boere
Increased insight into grain farming in deep rural South Africa:
Participant farmers’ fields were individually mapped by Grain SA
mentors.
Data was forwarded to BFAP (Bureau for Food and Agricultural
Policy). It made it possible to profile each farmer, gain insight into
climate and growing conditions and tailor information transfer
appropriately for farmers.
Others benefitting from the project:
Groter insig in graanboerdery in afgeleë landelike Suid-Afrika:
Deelnemende boere se landerye is individueel deur Graan SA-
mentors gekarteer.
Data is aan BFAP (Buro vir Voedsel- en Landboubeleid) gestuur. Dit
het dit moontlik gemaak om ’n profiel vir elke boer saam te stel, insig
in klimaats- en groeitoestande te kry en inligtingoordrag vir elke boer
aan te pas.
Ander wat by die projek baat: