


 77 / 84

75
April 2018
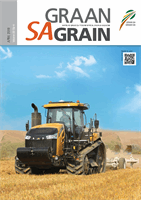
The lag is between three and six months,
with an average of four months. This as-
sumption was supported by statistical tests,
as well as the general opinion of the indus-
try. The transmission of maize to maize meal
is slower when the maize price decreases.
The delayed price transmission in retail
stores may occur for a variety of reasons,
including re-pricing (such as printing new
shelf price labels) or temporary input price
changes.
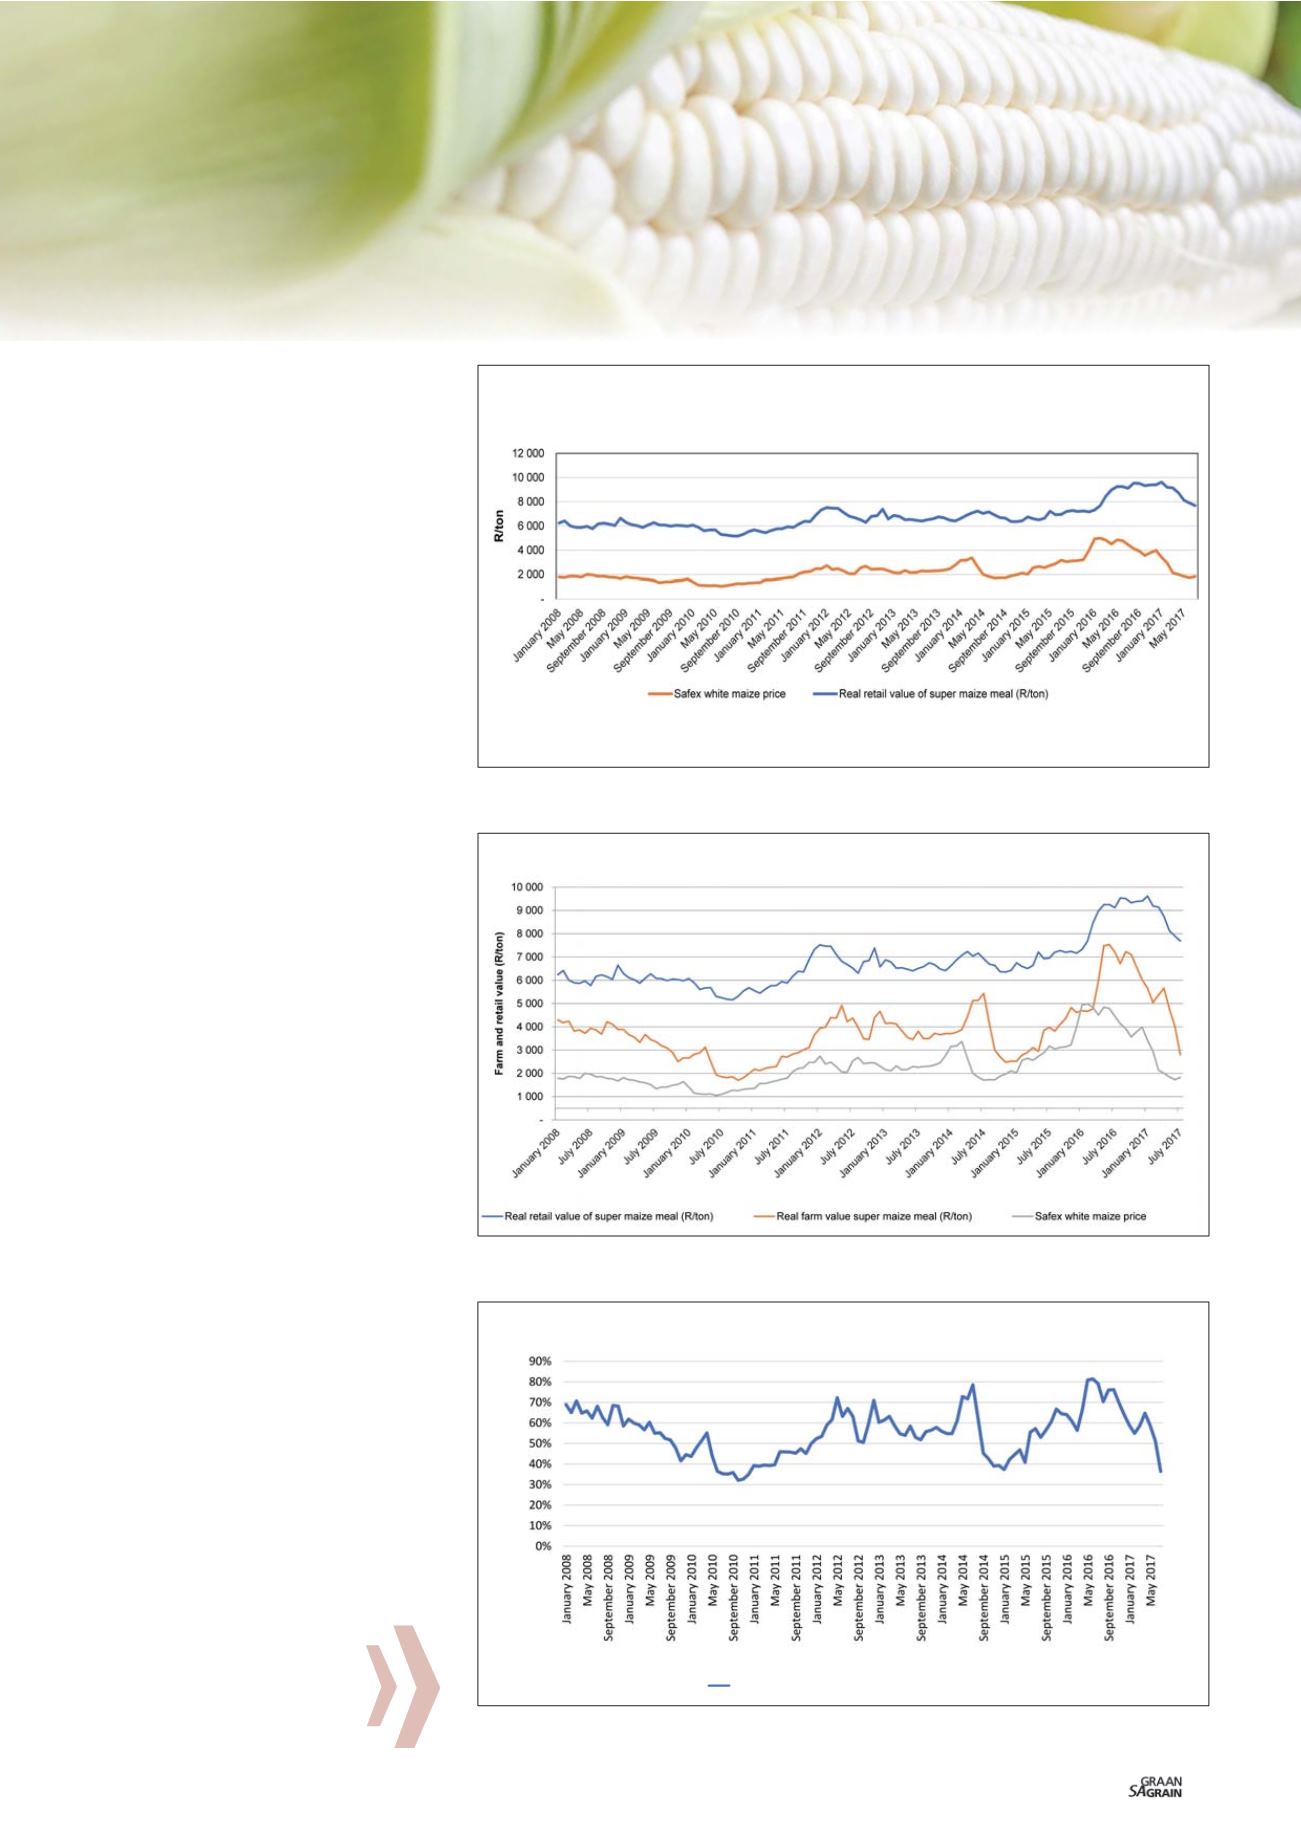
Farm value of super
maize meal
The farm value is the value of the farm prod-
uct’s equivalent in the final food product
purchased by the consumers. The retail val-
ue is the price or the value of a given prod-
uct at the retail level of a given commodity
value chain.
Take note: Due to the data limitation for the
monitoring of an average retail price for
special maize meal (5 kg) by Stats SA for the
period February 2015 to July 2017, this sec-
tion will only include the spread for super
maize meal (5 kg).
Graph 3
shows the trend in real farm and
retail values of super maize meal, between
January 2008 and July 2017. The real farm
value of super maize meal increased from
R4 300/ton in January 2008 and peaked
at R7 532/ton in June 2016. The real retail
value was R6 387/ton in February 2008 and
increased to R9 537/ton in October 2016
and has since that period decreased signifi-
cantly.
The farm value share is the portion pro-
ducers received from the amount consum-
ers pay for the product.
Graph 4
displays
the trend in the farm value share for super
maize meal. The farm value share of super
maize meal increased between early 2008
and 2016. Between 2008 and 2012, the
average farm value share of super maize
meal fluctuated between 32% and 72%,
reaching 64% in December 2016. In 2017,
the farm value share fluctuated between
30% and 64%.
The farm-to-retail-price-spread is the differ-
ence between what the consumer pays for
the food product at retail level and the value
of the farm product used in that product.
Graph 3: Real retail value and farm value of super maize meal.
Sources: Safex (2017), Stats SA (2017) and own calculations
Graph 4: Real farm value share of super maize meal.
Source: Safex (2017), Stats SA (2017) and own calculations
Graph 2: Retail price versus producer price changes.
Source: Safex (2017) and Stats SA (2017)
Farm value share
Farm value share (super maize meal)