


 37 / 44

35
December 2017
Limpopo (seven samples) reported the
lowest average percentage screenings of
1,09%. The weighted national average was
2,34% compared to the 2,05% of the previ-
ous season. The maximum permissible de-
viation according to the grading regulations
is 4%.
Sclerotia of
Sclerotinia sclerotiorum
were
observed on 18 of the samples (10%), com-
pared to the nine and eleven of the previous
two seasons respectively. 14 of these sam-
ples originated in the North West Province
and three in the Free State.
The highest percentage (1,8%) was pre-
sent on a sample from Mpumalanga. This
is, however, still well below the maximum
allowable level of 4%. Weighted average
levels ranged from 0% for the Gauteng and
Limpopo provinces, 0,03% in the Free State,
0,04% in the North West Province to 0,26%
in Mpumalanga. The national average of
0,04% was equal to the previous season.
The highest weighted percentage foreign
matter (1,77%) was reported for the seven
samples from Mpumalanga. The Free State
and North West Province averaged 1,61%
and 1,23% respectively. The lowest aver-
age percentage was found in Limpopo,
namely 1,01%. The South African average of
1,41% was the highest of the last three
seasons.
Test weight, providing a measure of the bulk
density of grain and oilseeds, does not form
part of the grading regulations for sunflower
seeds in South Africa. An approximation of
the test weight of these crop samples was
done by determining the g/1 litre filling
weight of each sample using the Kern 222
apparatus.
The test weight was then extrapolated by
means of formulas obtained from the Test
Weight Conversion Chart for Sunflower
Seed, Oil of the Canadian Grain Commis-
sion. The weighted average this season was
42,5 kg/hl. Individual values ranged from
35 kg/hl to 48,1 kg/hl. Last seasons’ values
ranged from 34 kg/hl to 50,5 kg/hl and aver-
aged 44,2 kg/hl. See
Graph 2.
Nutritional component analyses, namely
crude protein, -fat, -fibre and ash are re-
ported as percentage (g/100 g) on an ‘as
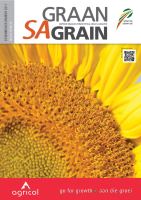
received’ or ‘as is’ basis. The weighted aver-
age crude protein content this season was
17,93%, almost 1% higher than the previ-
ous season and the highest average value
since the start of this survey in 2012/2013.
North West Province had the highest
weighted average crude protein content of
18,24% and Mpumalanga the lowest with
17,14%. The Free State’s crude protein con-
tent averaged 17,77%. Refer to
Graph 3
.
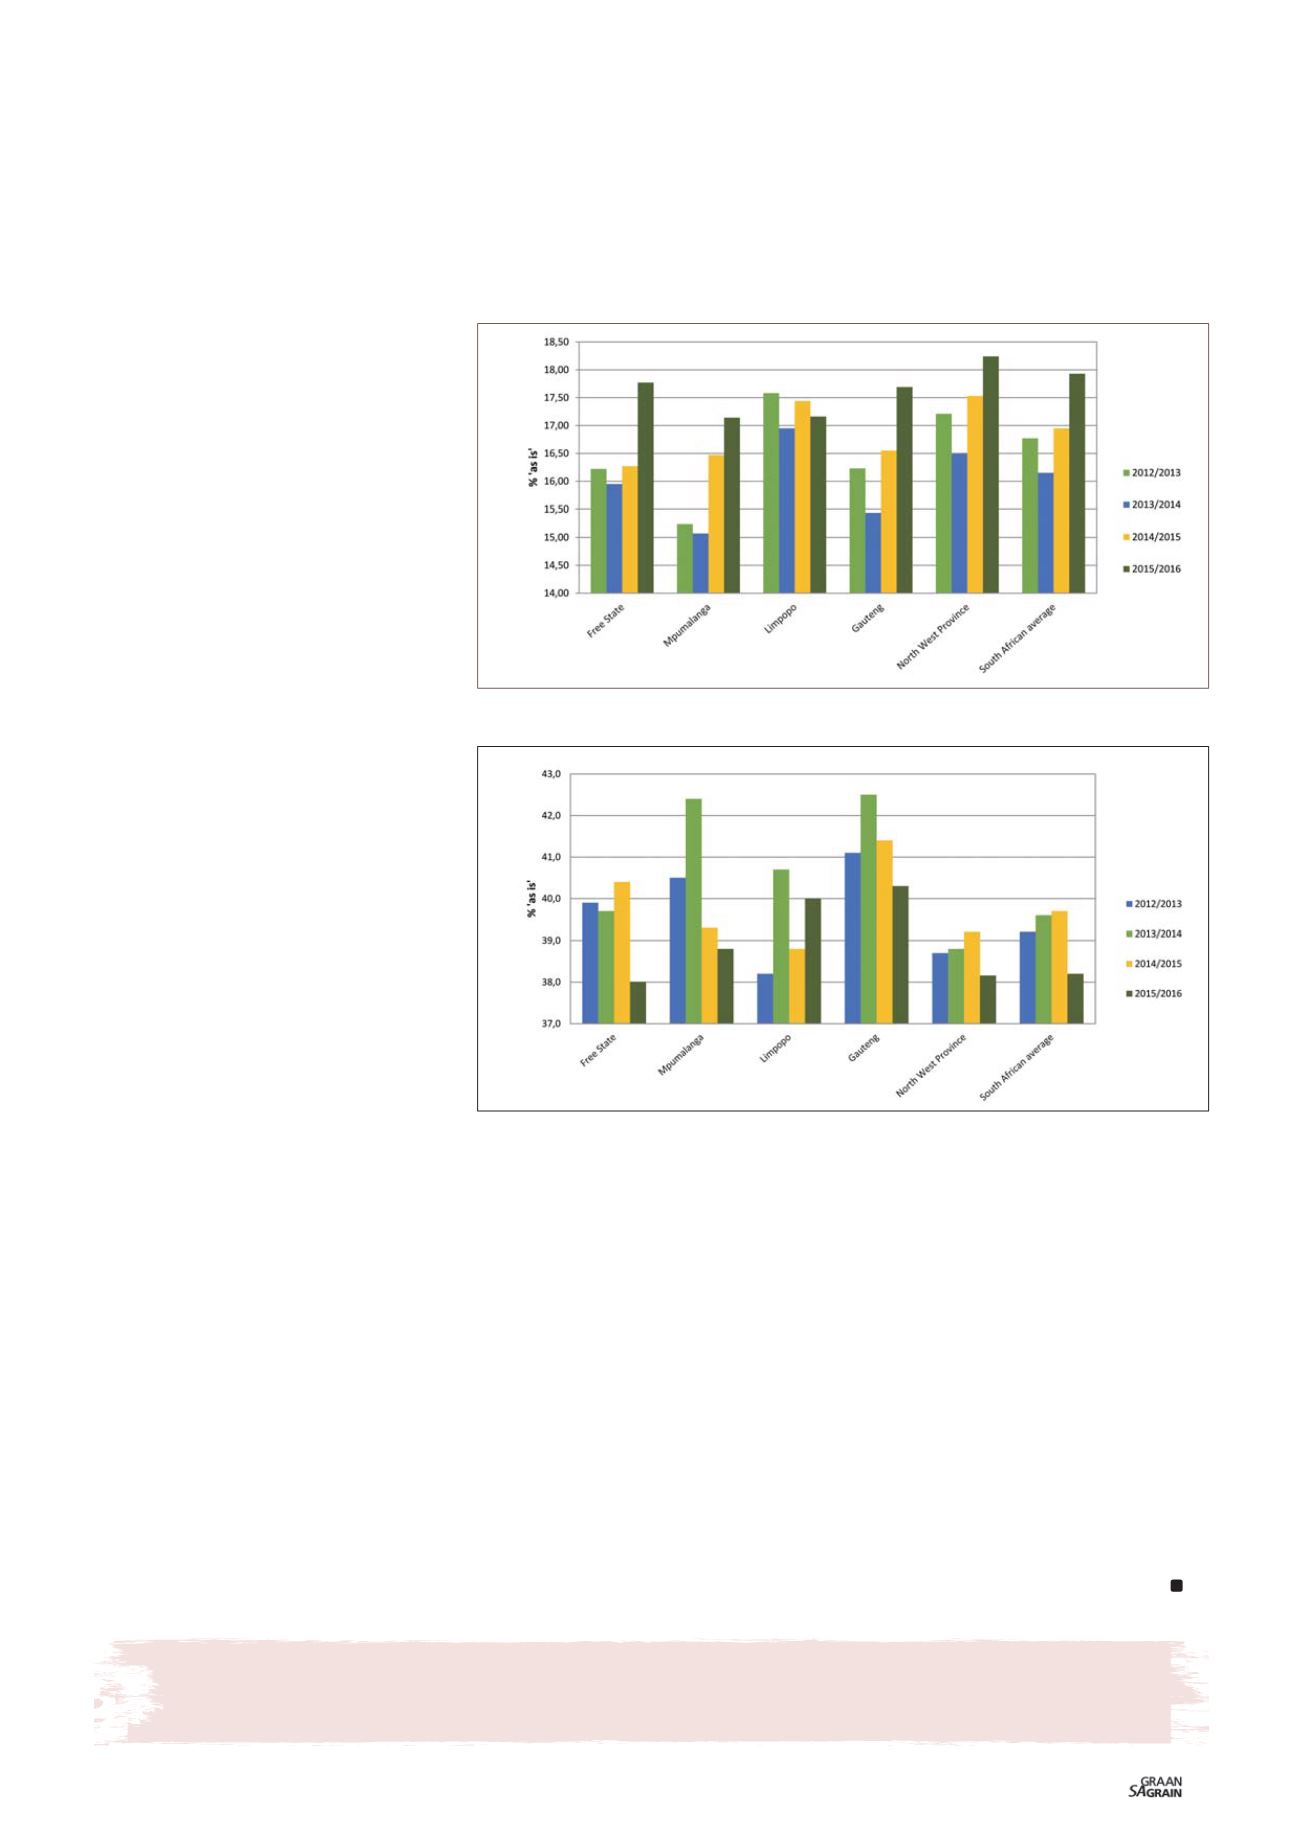
The weighted average crude fat percent-
age of 38,2% was the lowest of the last four
seasons and 1,5% lower than the previous
season. Gauteng had the highest weighted
average crude fat content of 40,3%. The
lowest average fat content was observed
in the Free State (38%). North West Prov-
ince and Mpumalanga averaged 38,2% and
38,8% respectively. See
Graph 4
.
Weighted average percentage crude fibre
increased slightly from 20% in the previ-
ous season to 20,3% this season. Average
values varied between 19,2% in Gauteng to
20,9% in Mpumalanga. The weighted aver-
age ash content is slightly higher (2,59%)
than last season (2,55%). The provincial av-
erages ranged from 2,49% in Mpumalanga
to 2,69% in Limpopo.
The results of this survey are available on
the SAGL website (
www.sagl.co.za ). The
hard copy reports are distributed to all the
directly affected groups and interested par-
ties. The report is also available for down-
load in a PDF format from the website.
Graph 3: Average crude protein content per season.
Graph 4: Average crude fat content per season.
Gratitude
Thank you to the Oil and Protein Seed Development Trust who provided financial support for these annual surveys
and to the members of Agbiz Grain for supplying the crop samples.