37
November 2014
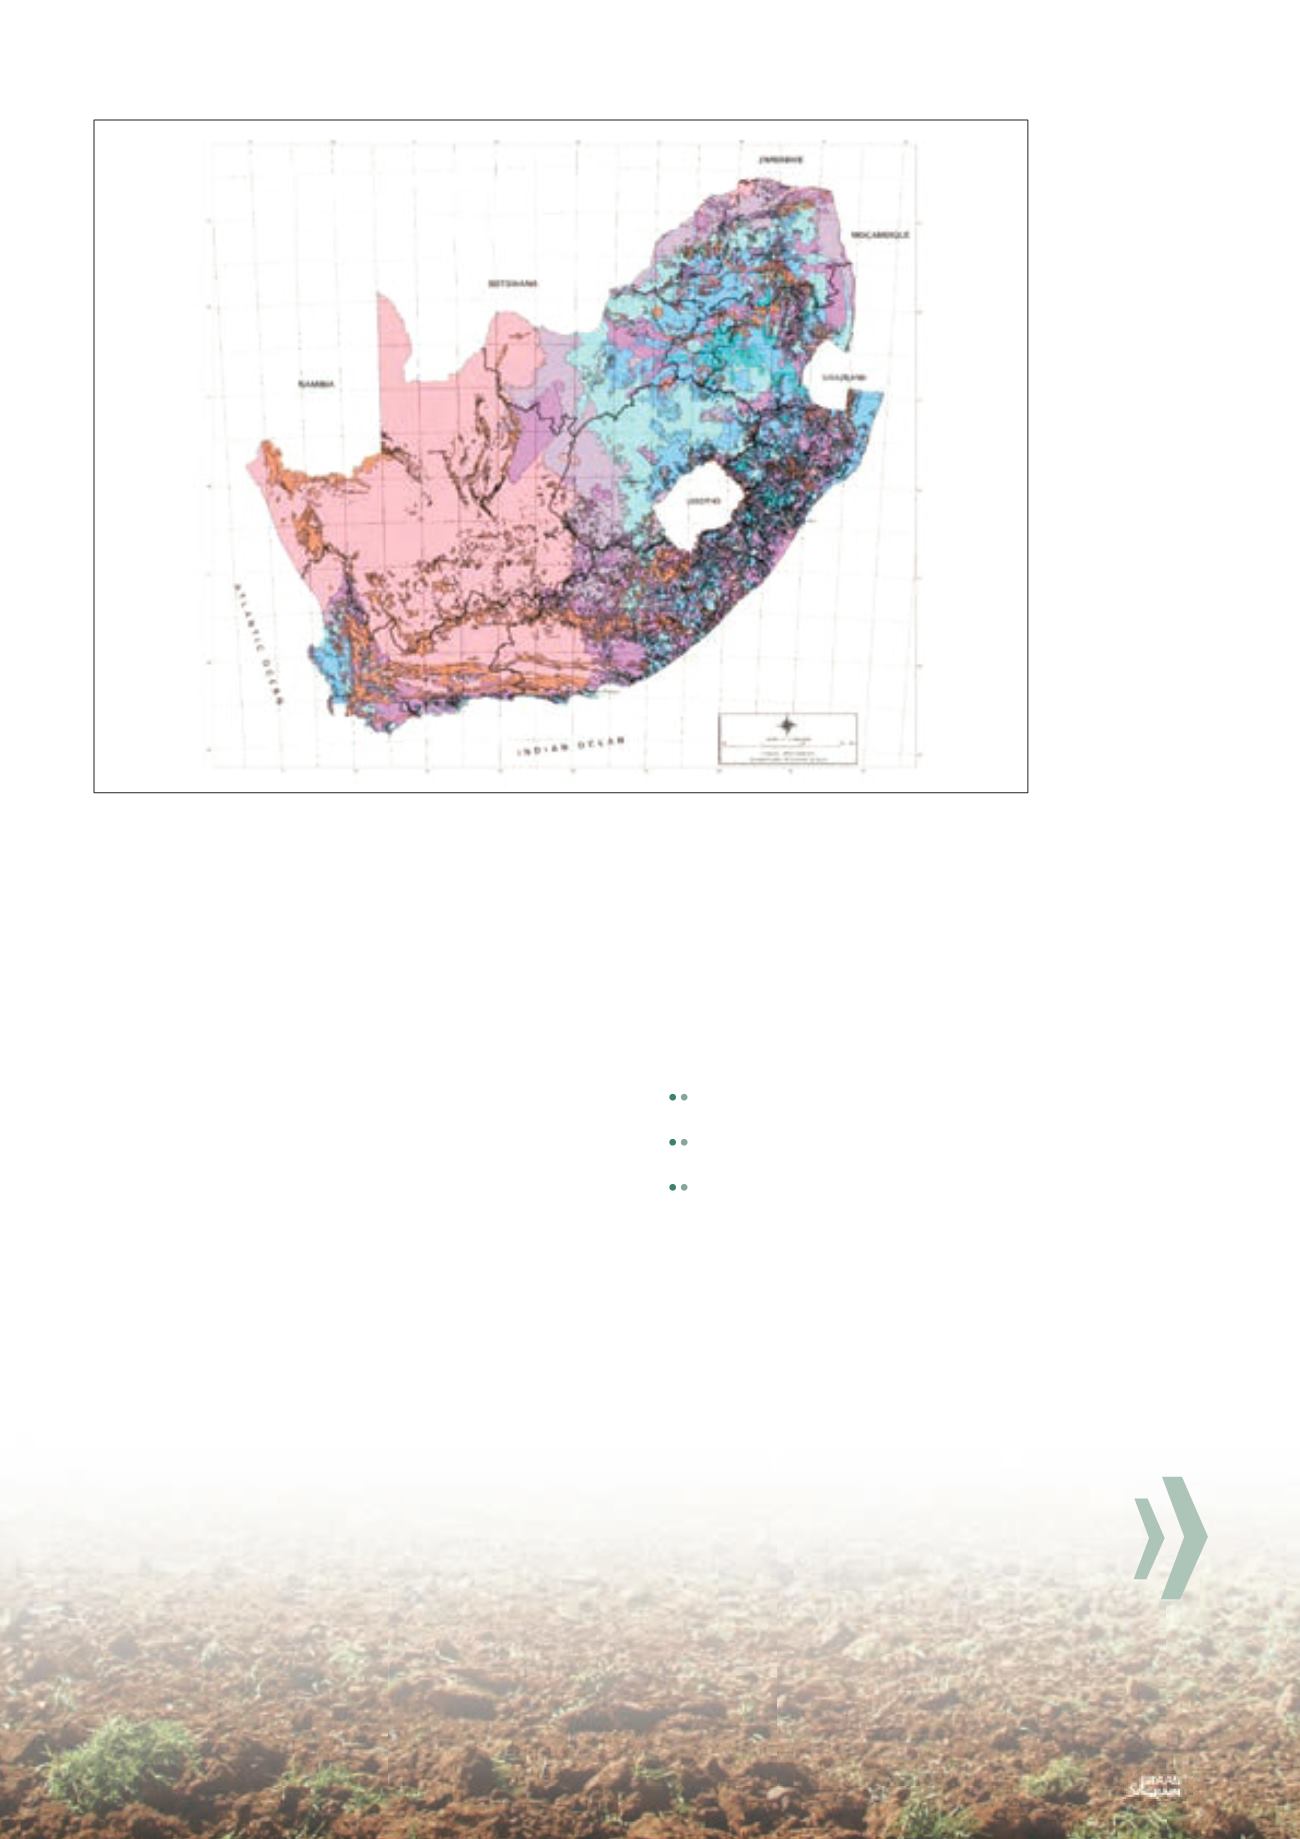
Figure 2: Land capabilitymapof SouthAfrica.
Copyright: ARC-ISCW
rockiness and/or an unfavourable climatic regime. Once the param-
eters are applied to the land typeunits, thedominant land capability
class of each can be established and the results are shown in the
mapbelow (Schoeman
et al.
, 2002).
The blue areas on the map represent the “better” classes of land
capability (Class I to IV), while the pink and purple areas represent
the rest (ClassesV toVIII) (see
Figure 2
).
Recently the ARC-ISCW has carried out a series of projects for a
rangeof clientswhere thebasic landcapabilityassessmenthasbeen
takenonestep further, namely toadjust ormatch theparametersbe-
ing assessed for a rangeof specific crops and their requirements.
This informationwas obtained from available literature from the ex-
isting knowledge and experience of the ARC-ISCW survey staff, as
well as a range of crop specialists as and when required. For each
crop, analgorithm (amathematical setof “instructions”)wascreated
and theparameters applied to the land typedata.
In other words, the land qualities were matched with the crop
requirements to assess the crop suitability of each land type. The
resultswere studied and comparedwith actual experience and em-
pirical crop yieldswherenecessary, so that eventually thebest pos-
sible result andmost reliablemap couldbeobtained for each crop.
Most of these algorithms were created for rainfed crop cultivation,
so that the required rainfall, temperature, frost-free season, as spe-
cific to each crop, had to be determined. However, for a number of
crops in specific areas that growespeciallywell under irrigation, the
climatic factors were omitted, leaving only the soil and terrain fac-
tors, with the assumption that most, if not all of the required crop
moisturewouldbe suppliedby irrigation.
This is especially relevant in the light of the fact that although only
around 10% of the cultivated area in South Africa is under irriga-
tion, it producesaround30%of thegrossvalueof thecountry’scrop
production (Scotney&VanderMerwe, 1995), andaround90%of the
fruit, wine andmost vegetables (Nieuwoudt
et al
., 2004).
The resultsof twoof thecrop suitabilitymapscanbe seen in
Figure3
,
where the potential for rainfedmaize (
a
) and rainfed soya (
b
) in the
NorthWest Province is shown.
The results generated from these algorithms provide:
An improved tool for regional planning, which can be coupled
with agricultural economic studies to compare crops.
Aneasilyadjustable tool toassessanycrop for any regionwhere
thebasicsuitabilityparametersareknownor canbedetermined.
Themeans to assess optimal landuses for a specific area.
The limitations due to the scale of the baseline information must
be taken into account, as well as the fact that cultivars and other
production practices are constantly evolving and improving. Small-
scale, reconnaissance or general natural resource surveys, such as
the Land Type Survey, only give a broad picture of the dominant
types and distribution of soil, climate and terrain that occur over
relatively large areas.
The landscape may actually include fairly significant areas of dif-
ferent soils that are not identified on the map, due to scale. As
such, reconnaissance surveys are best suited to making general
comparisons of land capabilities and limitations on a district and
national scale. They arenot reliable formakingon-farmdecisions as
they lack thedetailnecessary todescribe thevariation in thesoil types
on the farm.Whendetailedsoilsurveydata isneeded,butunavailable,
on-site investigations are necessary. On-farm soil surveys can be
designed for a specific purposeor a general purpose.


