


 49 / 64

White maize quality comparisons
– local versus imported
T
he drought had an enormous impact on our supply and
demand within the South African maize industry. The de-
crease in supply due to low production lead to an import
scenario of close to 3 million tons needed in order to satisfy
the demand.
The world is a yellow maize producer and world supplies were suf-
ficient. The challenge was with white maize.
At the beginning of the season we faced the first challenge, which
was if the infrastructure would be able to handle the vast amount
of grain and oilseeds that will be needed to satisfy demand. This
seems to be sorted and the infrastructure was up to now able to
handle the trade, given good planning between organised agricul-
ture, private sector and government.
The second uncertainty was the availability of non-GMO white
maize. As the crop improved and with the above expected yield of
the late plantings, this became less of a problem and currently the
expectation is that South Africa will import enough.
However, the free market and prices must still facilitate this pro-
cess until sufficient early deliveries are received in the new season.
Later in the year the approvals for GMO white maize imports were
also granted.
The third uncertainty was the quality of the imported white maize.
This is the topic that we are going to spend some time on.
Quality of imported maize
The South African Grain Laboratory (SAGL) constantly monitors
the quality of South African maize and imported maize. The SAGL,
funded by the industry, is an independent body that uses interna-
tional accredited sampling and analysis methodologies.
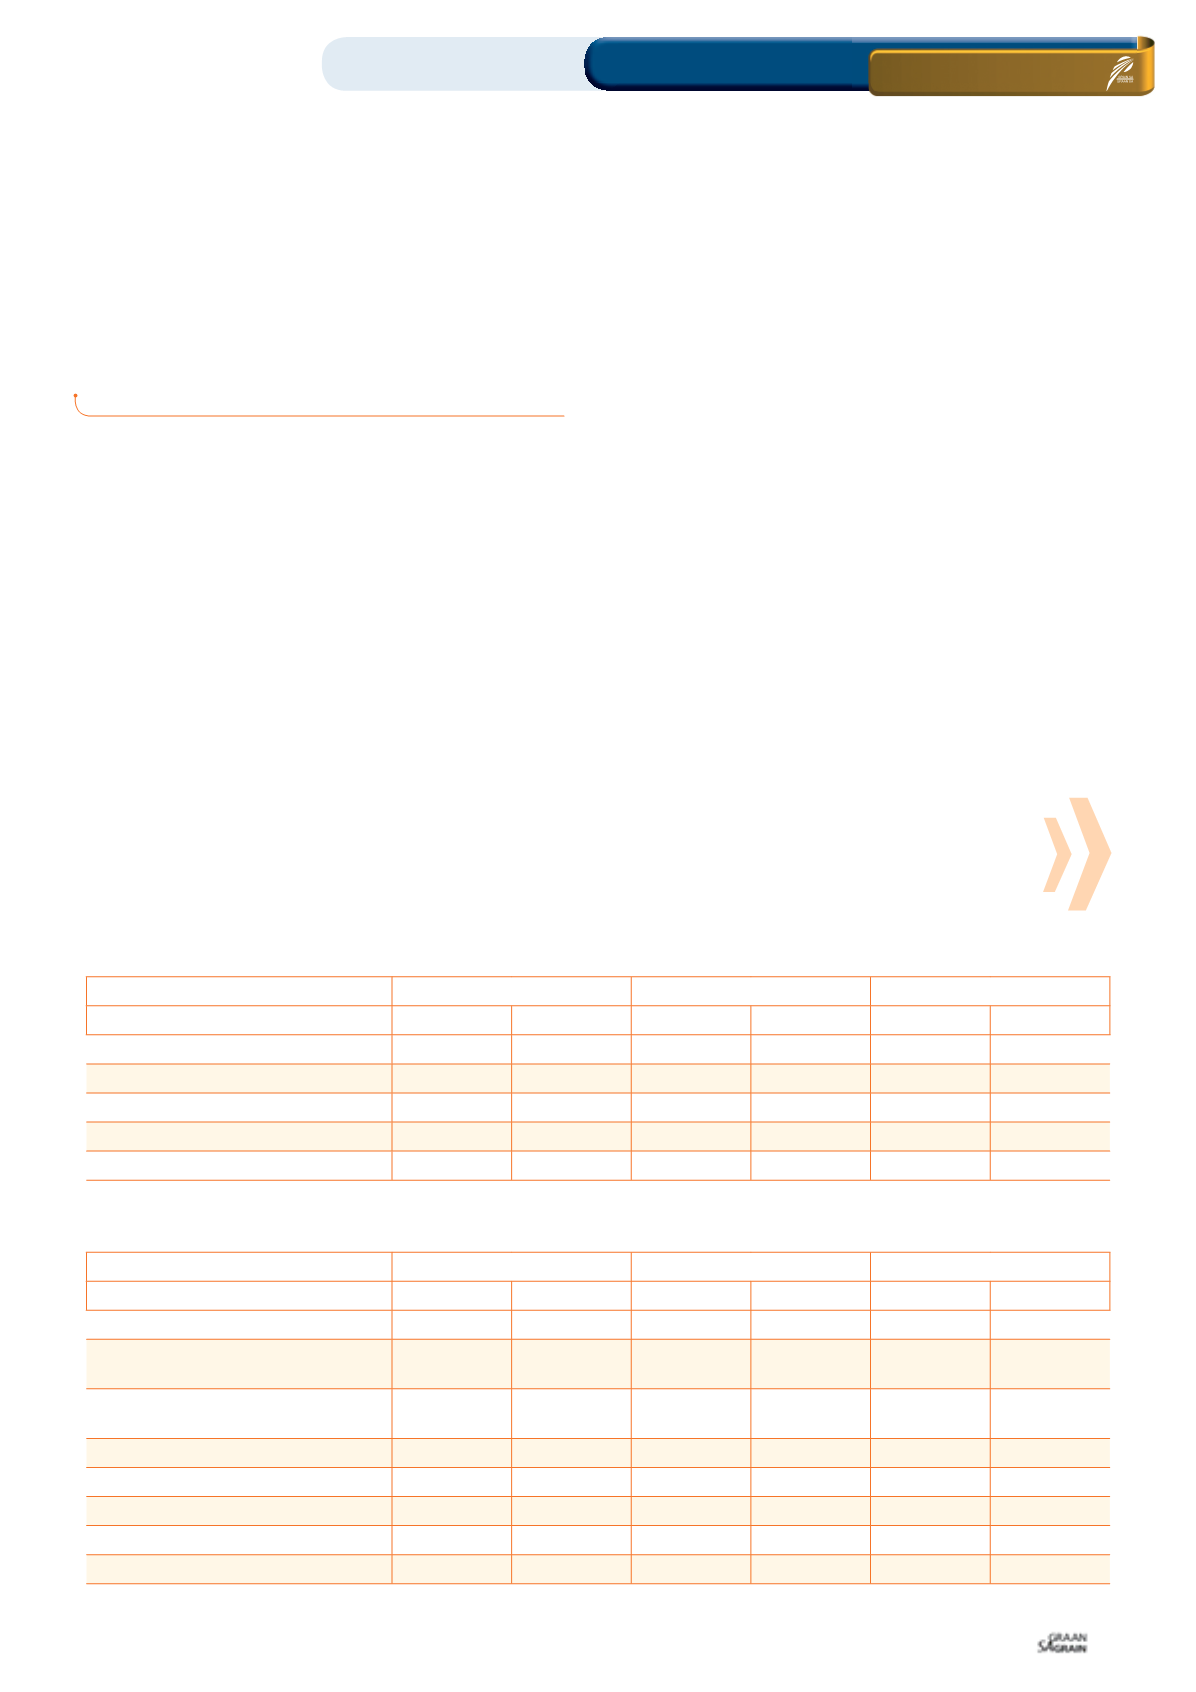
According to the SAGL, the imported white maize and the South
African white maize are very similar to each other in terms of nu-
trient contents. The comparisons are done in terms of a WM1
and weighted average between currently imported maize and the
South African 2014/2015 crop.
This was also the case in terms of grading and it is clear from the
grading variables that the imported white maize grades were
similar to that of the local white maize. It is clear though, that there
is a difference when comparing the Mexican maize to the South
African maize and the USA maize in terms of defective kernels.
47
February 2017
DIRK STRYDOM,
manager: Grain Economy and Marketing, Grain SA
COUNTRY OF ORIGIN
MEXICO
SOUTH AFRICA
USA
CLASS AND GRADE WHITE MAIZE
WM1
AVERAGE
WM1
AVERAGE
WM2
AVERAGE
Nutritional factors
Protein, %(db)
8,8
8,8
9,4
9,4
8,4
8,4
Fat, %(db)
4,6
4,6
4,2
4,2
3,6
3,6
Starch, %(db)
73,8
73,5
72,6
72,6
75,9
75,9
Number of samples
28
49
402
485
2
2
COUNTRY OF ORIGIN
MEXICO
SOUTH AFRICA
USA
CLASS AND GRADE WHITE MAIZE
WM1
AVERAGE
WM1
AVERAGE
WM2
AVERAGE
South African grading
Defective kernels above 6,35 mm
screen, %
2,8
6,5
2,3
3,1
2,8
2,8
Defective kernels below 6,35 mm
screen, %
3,1
3,6
1,7
2,2
5
5
Total defective kernels, %
5,9
10,2
4
5,3
7,7
7,7
Other colour maize kernels, %
0,2
0,1
0,3
0,4
0
0
Foreign matter, %
0,2
0,2
0,1
0,1
0,3
0,3
Combined deviation, %
6,2
10,5
4,4
5,8
8
8
Number of samples
33
60
402
485
2
2
TABLE 1: NUTRIENT CONTENT.
TABLE 2: SOUTH AFRICAN GRADING STANDARDS.
Source: SAGL
Source: SAGL
ON FARM LEVEL
Quality
Maize / Analysis / Sampling