


 98 / 108

Augustus 2018
96
On farm level
Sustainability
Wheat turnaround strategy
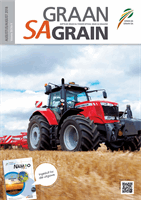
Graph 4: Impact of the scenarios on gross margins (income - direct cost, excluding fixed costs).
Source: BFAP
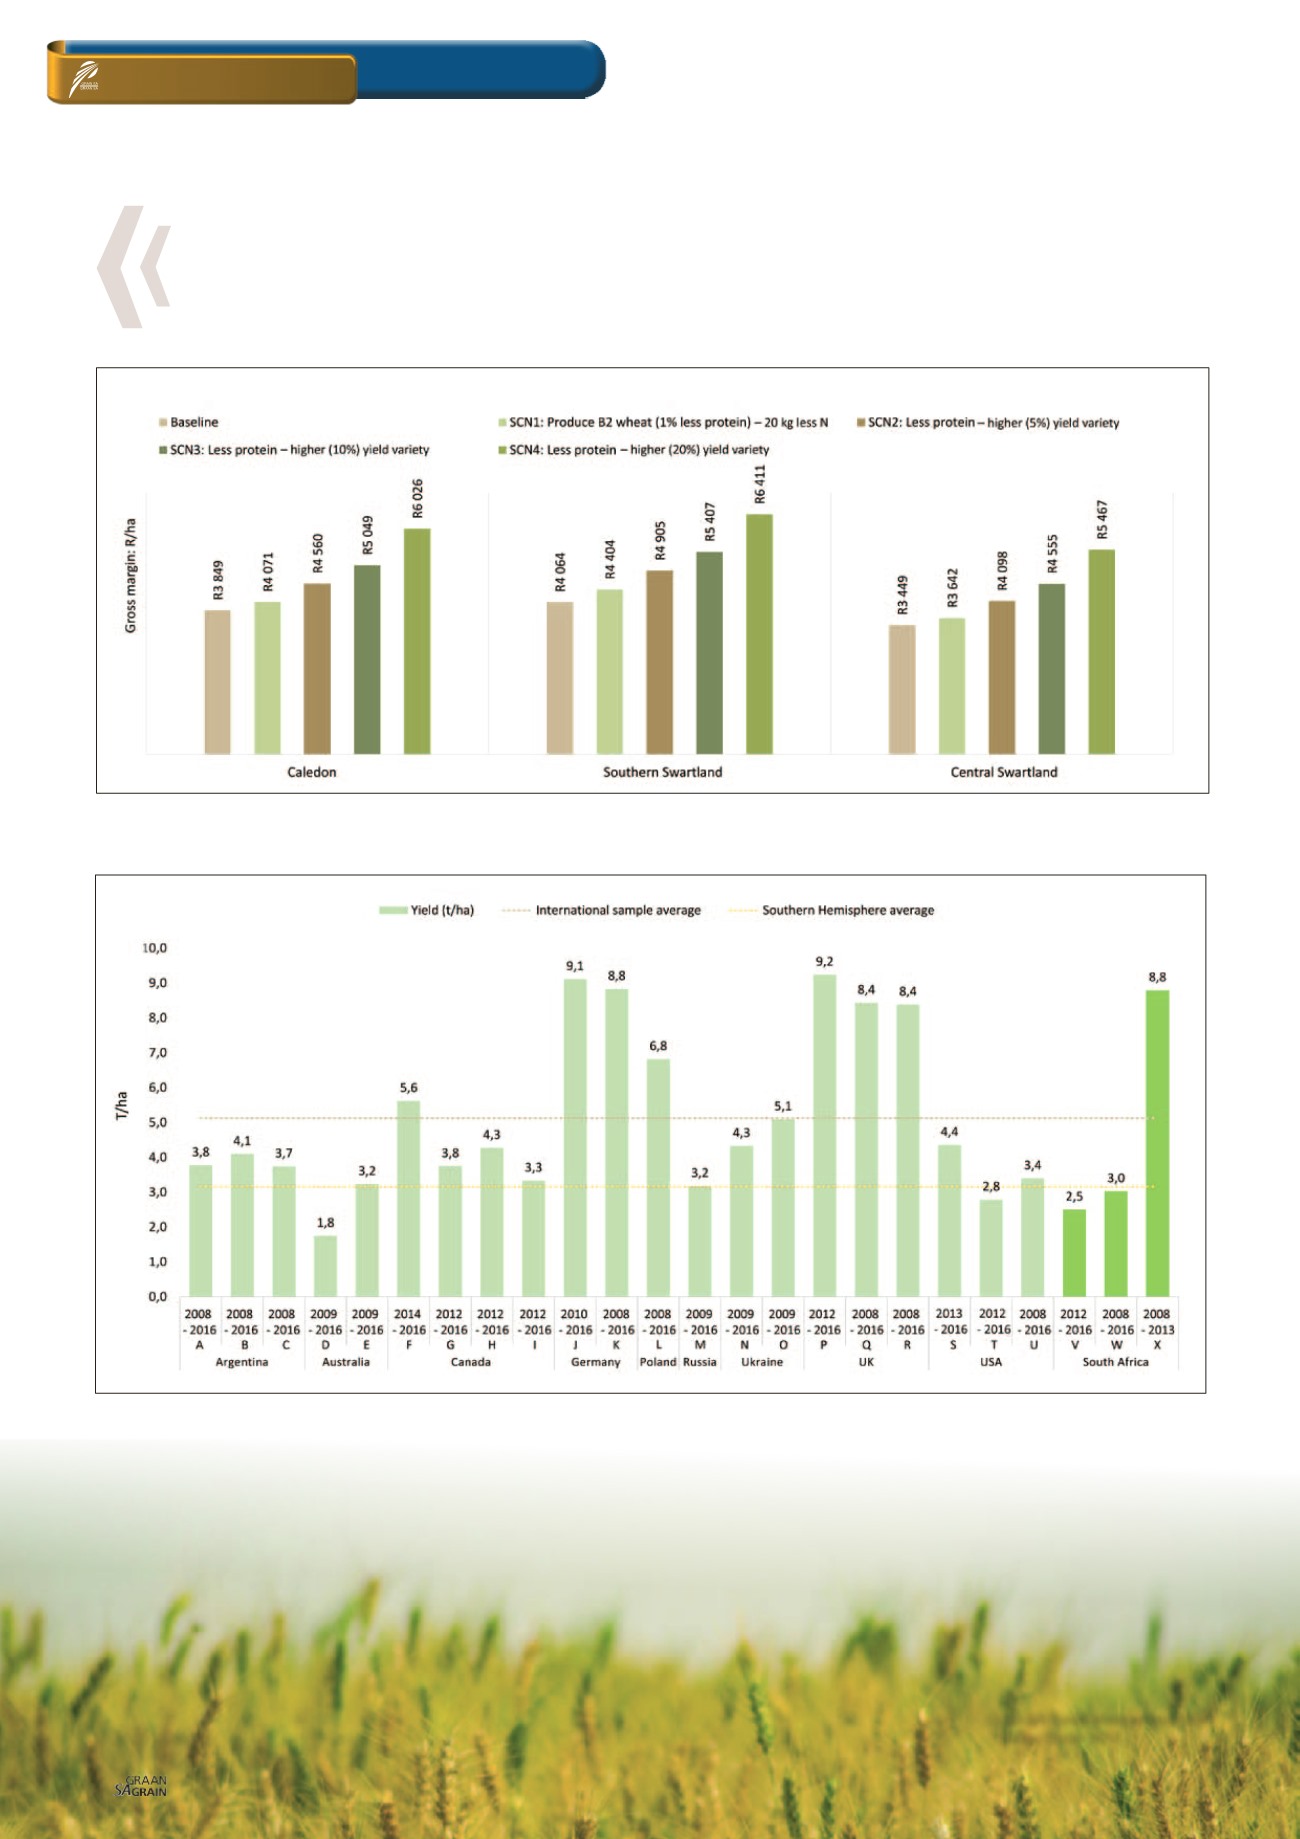
Graph 5: International yield comparisons.
ABCD....An indication of different farms in the respective countries
V = Eastern Free State
W = Overberg
X = Northern Cape irrigation
Source: International
agri benchmark
network and BFAP
Grain SA/Sasol photo competition
– Corlea Enslin 2017