


 125 / 138

121
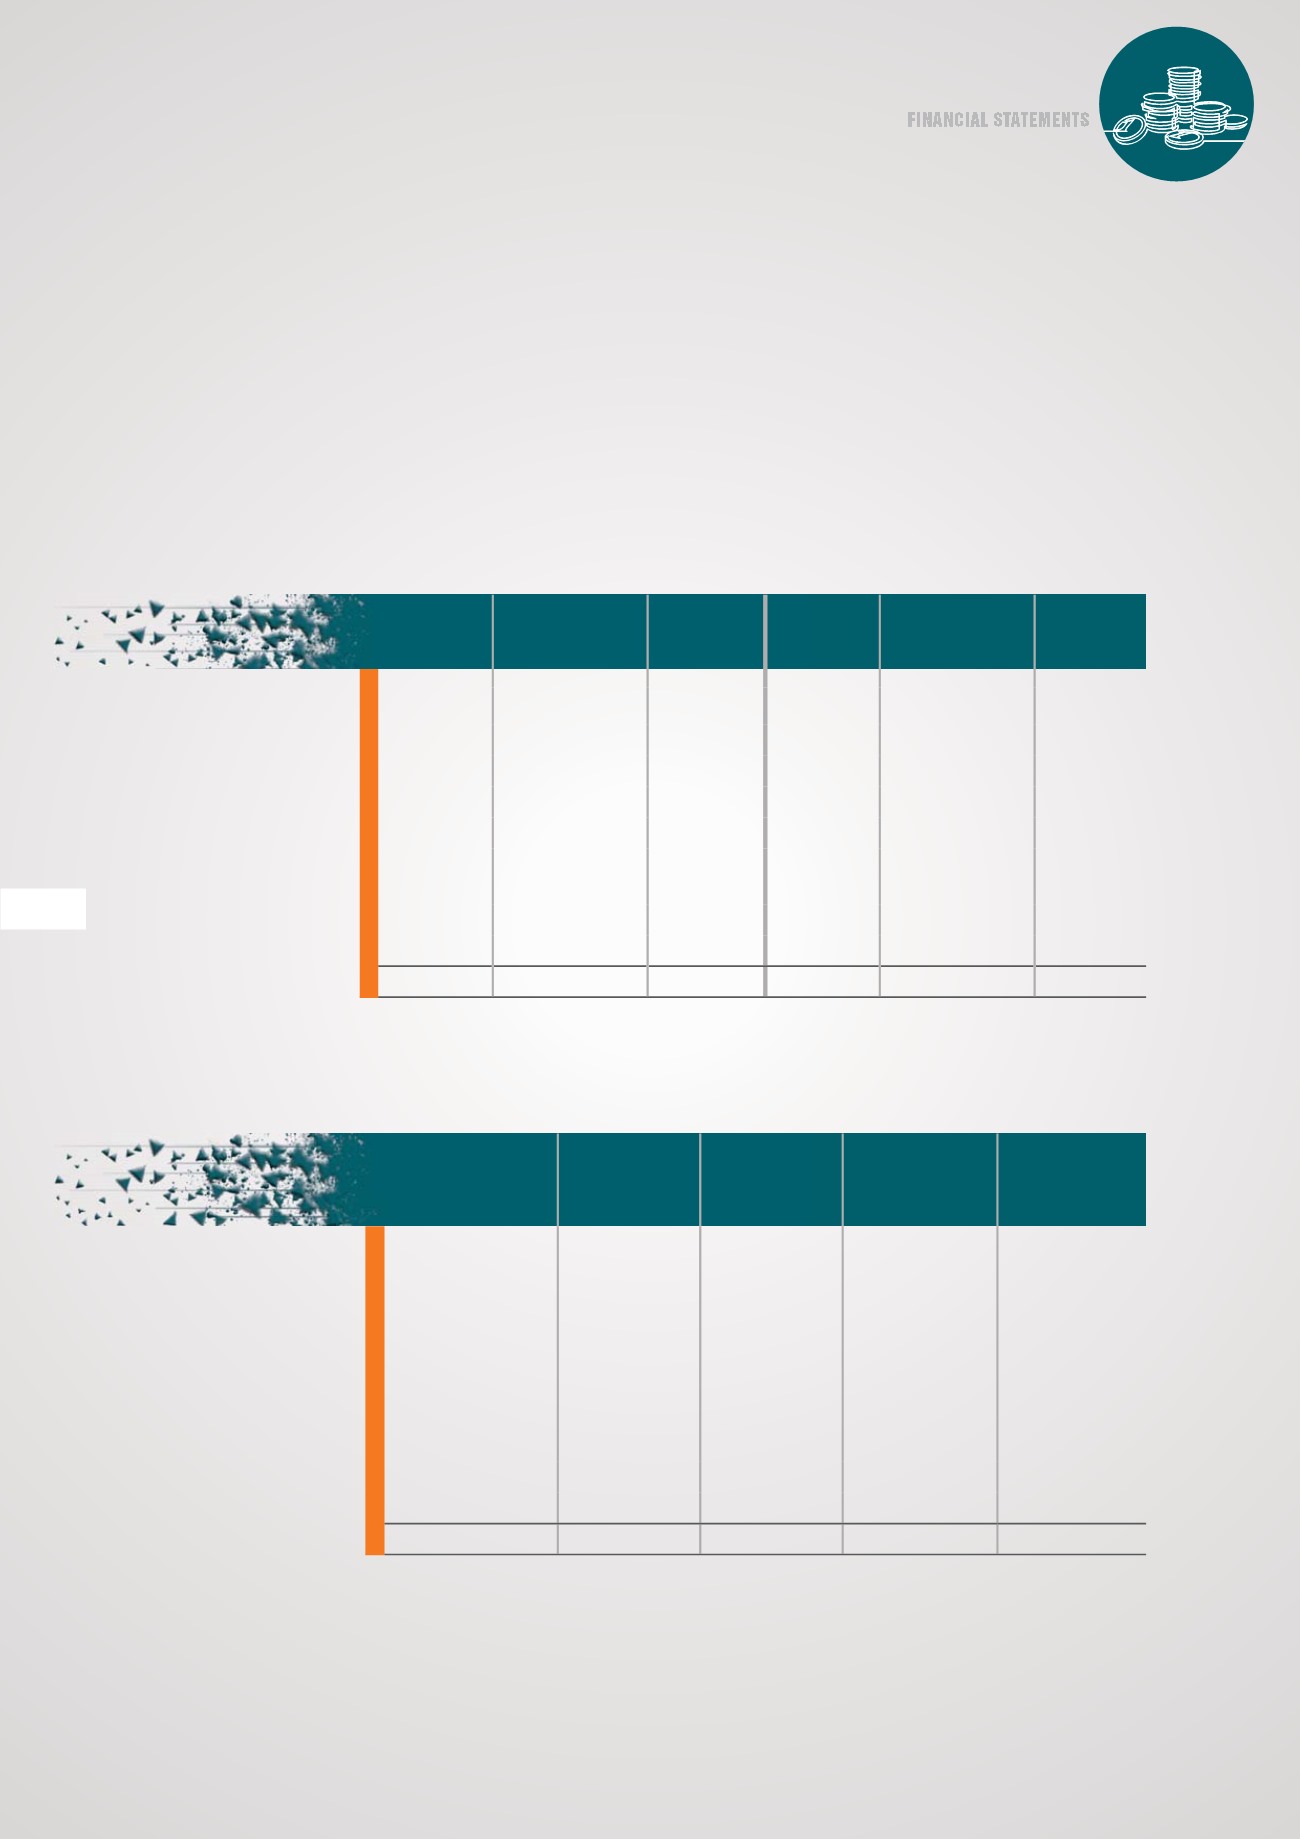
2022
2021
COST
ACCUMULATED
DEPRECIATION
CARRYING
VALUE
COST
ACCUMULATED
DEPRECIATION
CARRYING
VALUE
Owned assets
Land and buildings
53 335 696
(28 439 344) 24 896 352
53 068 166
(26 942 075) 26 126 091
Plant and equipment
3 375 494
(3 098 263)
277 231
3 602 709
(3 078 017)
524 692
Motor vehicles
189 909
(171 142)
18 767
740 565
(711 798)
28 767
Furniture and fittings
2 661 309
(2 264 588)
396 721
2 887 273
(2 220 797)
666 476
Catering and other
equipment
539 316
(459 113)
80 203
536 101
(417 061)
119 040
Office equipment
399 342
(357 283)
42 059
401 656
(305 884)
95 772
IT equipment
3 363 670
(2 865 375)
498 295
3 471 789
(2 922 834)
548 955
63 864 736
(37 655 108) 26 209 628
64 708 259
(36 598 466) 28 109 793
2022
CARRYING VALUE
AT BEGINNING
OF YEAR
ADDITIONS DISPOSALS DEPRECIATION
CARRYING
VALUE AT END
OF YEAR
Owned assets
Land and buildings
26 126 091
267 530
-
(1 497 269)
24 896 352
Plant and equipment
524 692
-
(1)
(247 460)
277 231
Motor vehicles
28 767
-
-
(10 000)
18 767
Furniture and fittings
666 476
3 912
(24 690)
(248 977)
396 721
Catering and other
equipment
119 040
3 215
-
(42 052)
80 203
Office equipment
95 772
-
-
(53 713)
42 059
IT equipment
548 955
324 834
(98 742)
(276 752)
498 295
28 109 793
599 491
(123 433)
(2 376 223)
26 209 628
FOR THE YEAR ENDED 30 SEPTEMBER 2022
3. Property, plant and equipment
The carrying amounts of property, plant and equipment can be reconciled as follows:
Notes
TO THE ANNUAL
FINANCIAL STATEMENTS