


 21 / 116

19
October 2017
or be directly applied to the crop with a spe-
cific type of irrigation system.
The developed South African framework
covers four levels of water management in-
frastructure, (as shown in
Table 1
): i.e. the
water source, the bulk conveyance system,
the irrigation scheme and the irrigation farm
and the relevant water management infra-
structure.
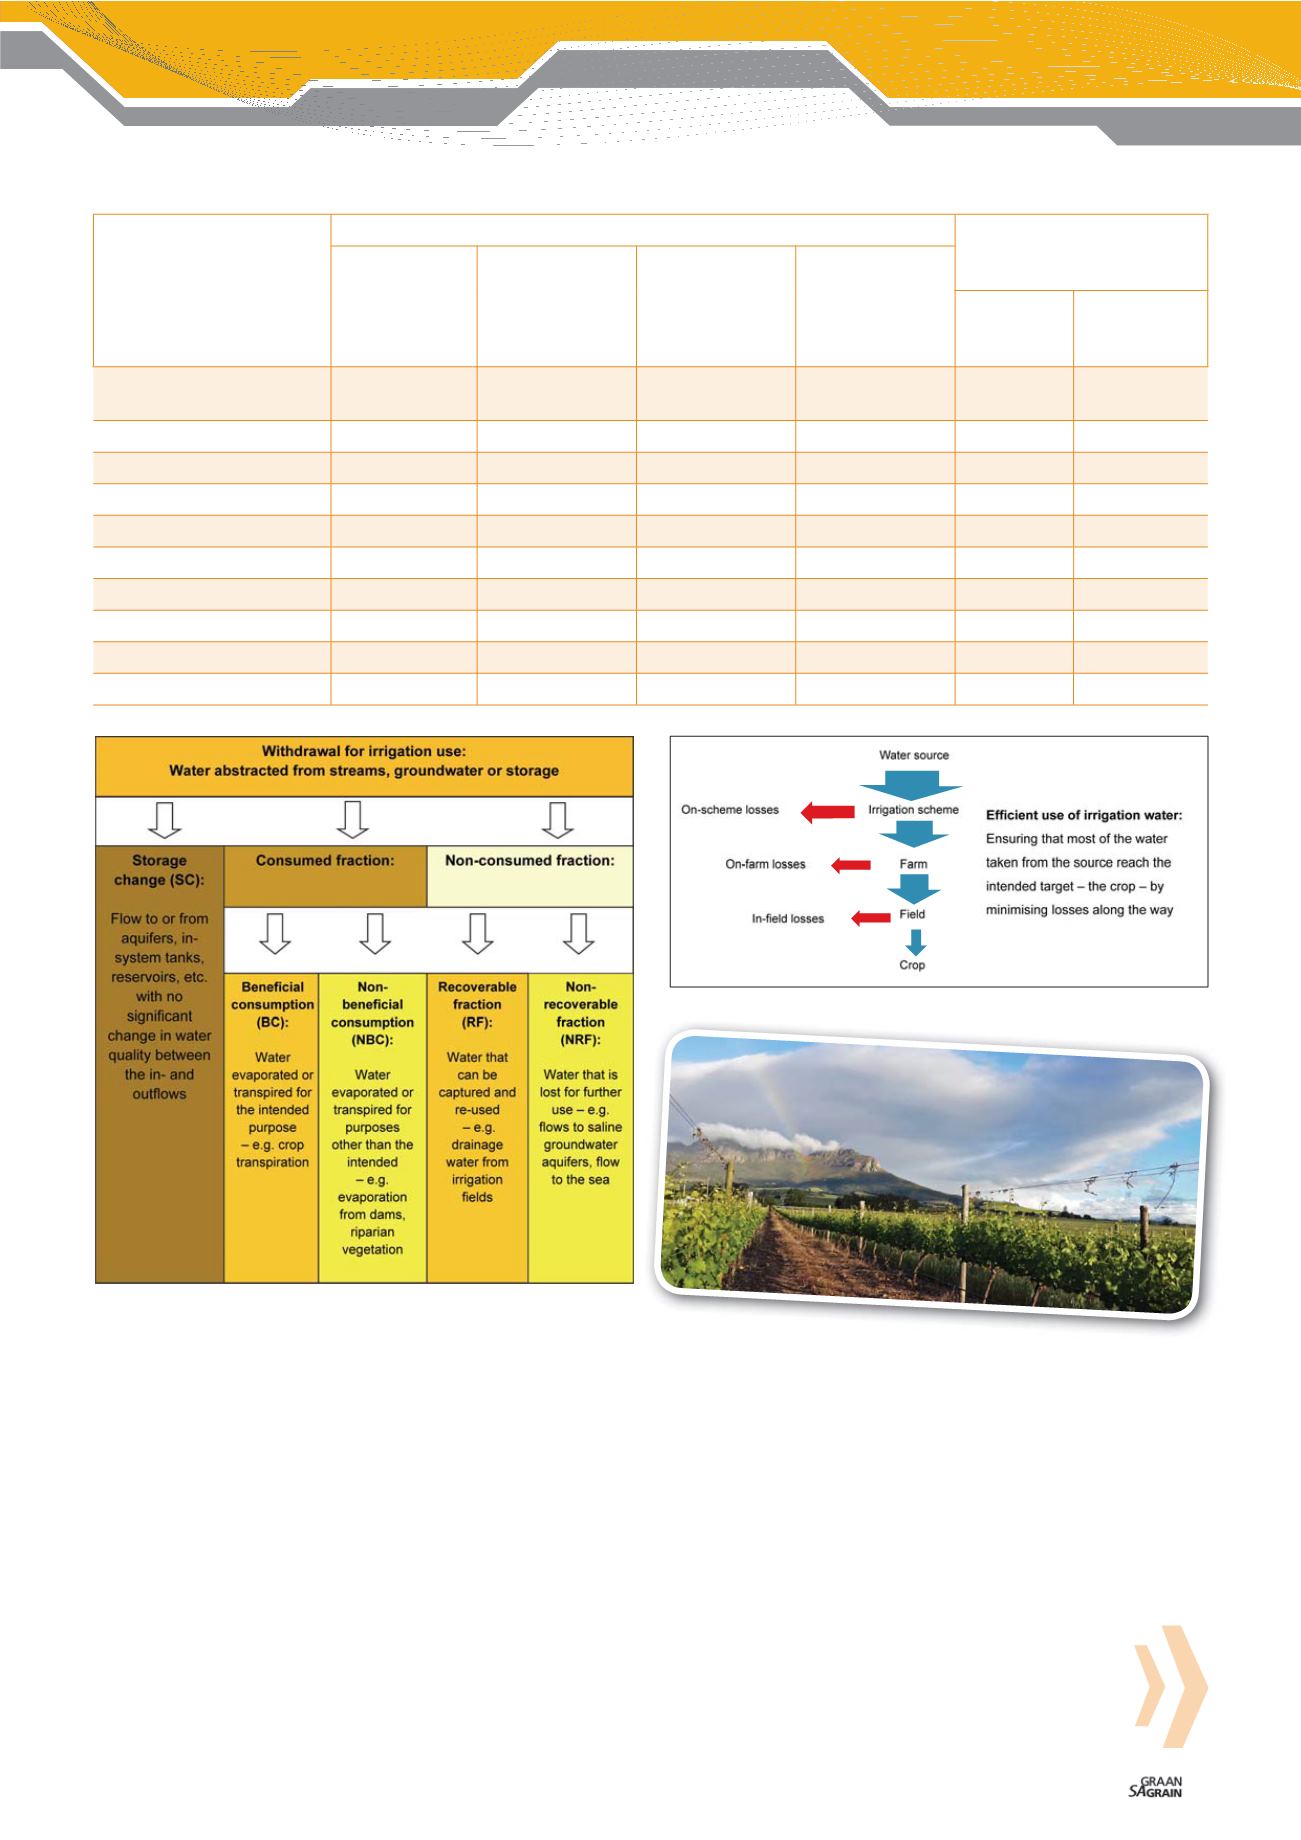
In order to improve water use efficiency in
the irrigation sector, actions should be taken
to reduce the non-beneficial consumption
(NBC) and non-recoverable fraction (NRF).
Due to the fact that
Table 2
has been drawn
up from an irrigation system perspective,
there is not much that the practitioner can
do to recover water in some of the infra-
structure components. In the case of irriga-
tion, losses occur at different levels of water
management as shown in
Figure 2
.
Unfortunately, historical reporting of ir-
rigation efficiencies (such as ‘application
efficiency’, ‘system efficiency’, ‘distribution
efficiency’ and ‘transportation efficiency’)
has resulted in the diminished understand-
ing and scrutiny of the source or causes
of losses. There is a widespread illusion
that efficiency is fixed by the type of ir-
rigation infrastructure used rather than to
the way a particular system has been de-
signed and managed. In the past, improving
performance and efficiency were, incor-
rectly, only associated with an upgrade in
infrastructure (e.g. a change in irrigation
system).
The framework can also be applied to re-
assess the system efficiency indicators
typically used by irrigation designers when
making provision for losses in a system and
converting net to gross irrigation require-
ment. A total of 75 irrigation systems were
evaluated and a new set of system efficiency
(SE) values for design purposes was there-
fore developed. These values are illustrated
in
Table 3
. These values should not be con-
fused with Table 2’s values, because Table 2
provides the water balance framework from
a holistic point of view and Table 3 provides
only the irrigation system efficiency values.
IRRIGATION SYSTEM
LOSSES
DEFAULT SYSTEM
EFFICIENCY (NET TO
GROSS RATIO)
NON-BENEFI-
CIAL SPRAY
EVAPORATION
AND WIND
DRIFT (%)
IN-FIELD
CONVEYANCE
LOSSES (%)
FILTER AND
MINOR LOSSES
(%)
TOTAL LOSSES
(%)
MIN (%)
MAX (%)
Drip (surface and subsur-
face)
0
0
5
5
90
95
Micro spray
10
0
5
15
80
85
Centre pivot, linear move
8
0
2
10
80
90
Centre pivot LEPA
0
0
5
5
85
95
Flood: Piped supply
0
0
5
5
80
95
Flood: Lined canal supplied
0
5
5
10
70
90
Flood: Earth canal supplied
0
12
5
17
60
83
Sprinkler permanent
8
0
2
10
75
90
Sprinkler movable
10
5
2
17
70
83
Travelling gun
15
5
2
22
65
78
TABLE 3: DEFAULT IRRIGATION SYSTEM EFFICIENCY VALUES.
Figure 1: Water balance framework for irrigation water management.
Figure 2: Definition of irrigation efficiency.