- Follow us:
- Our Commodities:
-
December 2015
|
|
||
|
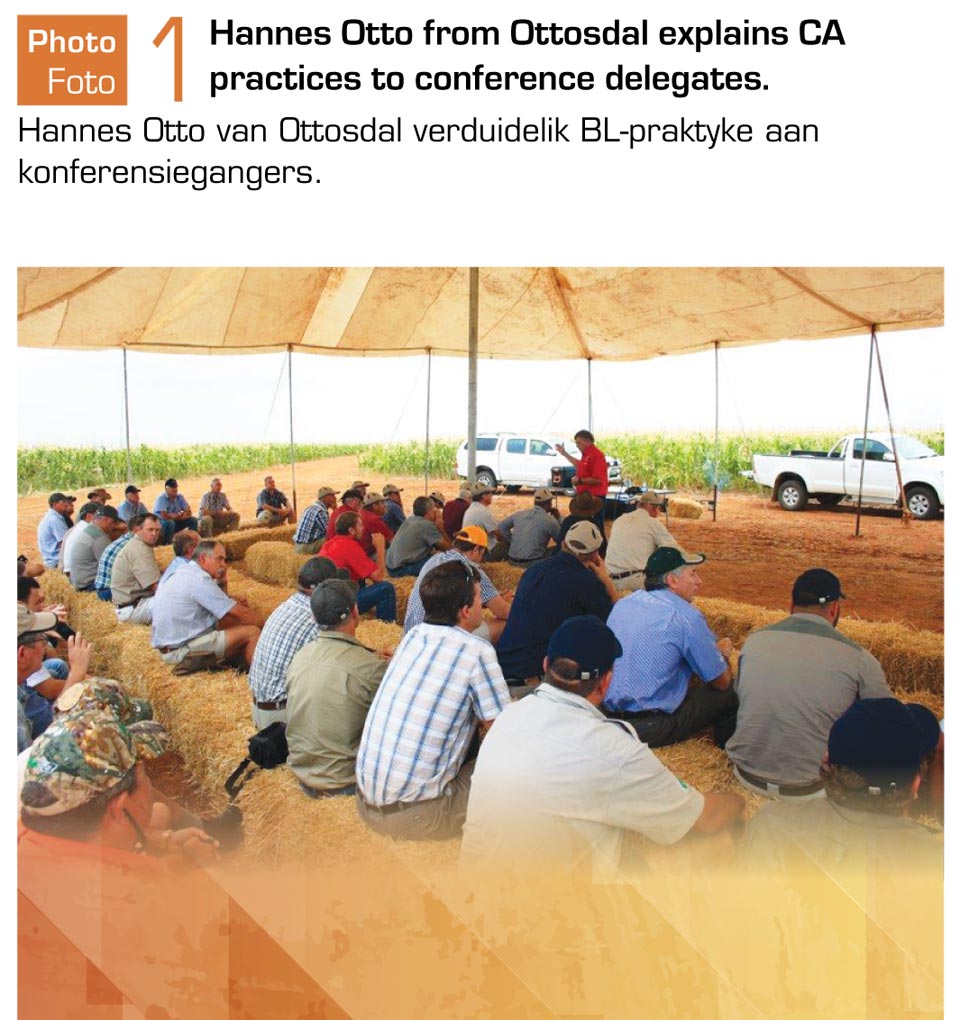
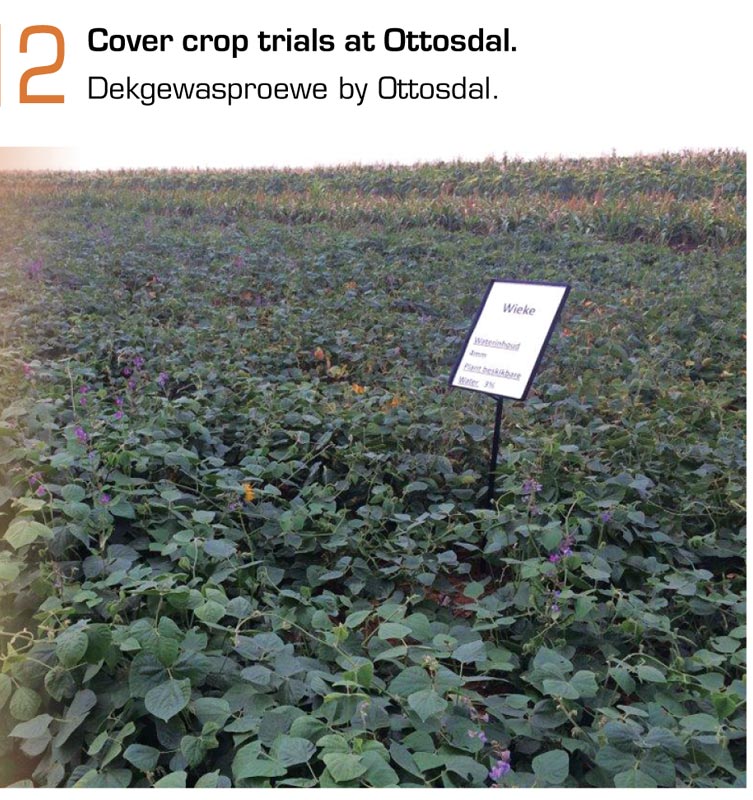
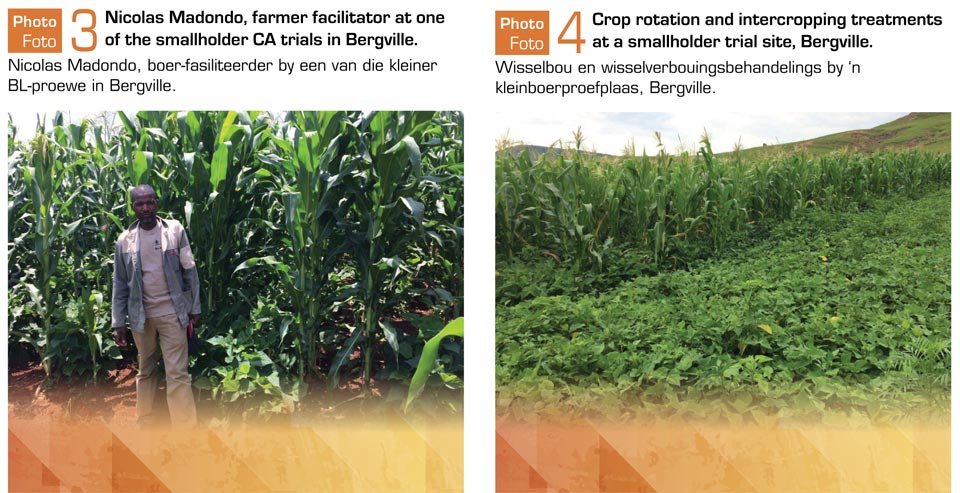
STRATEGIC RESEARCH FOCUS AREAS Recognising that research and development (R&D) and innovation are key drivers to improving productivity and sustainability in the sector; producers are constantly confronted with new challenges, such as staying competitive in the free market. We prioritise crop improvement as a strategic focus area as seed is one of the most important inputs to improve yields and thus profitability. Grain SA has further ventured into collaboration and building on our trust relations with the (Department of Agriculture, Fisheries and Forestry [DAFF], Department of Science and Technology [DST], the Department of Trade and Industry [the dti]). We are in the process of developing a national framework (policy) for wheat R&D with DAFF. The intention of this document is to strengthen research capacity to meet challenges and support a culture of collaboration. This will increase understanding of emerging challenges between the policymakers and industry, encourage information sharing and support for additional funding. Some of the key strategic outputs were the establishment of a formal pre-breeding platform consortium for wheat with DST as a key partner and the beneficiaries being the three seed companies (Sensako, Pannar and the Agricultural Research Council [ARC]). This work is implemented by the University of Stellenbosch (US) and funded by DST. Further collaboration was sought with the assistance of DST to partner with other international key wheat producing countries. We were also successful to link private seed companies with public and international funding sources/institutions to strengthen our local wheat research agenda. With the support of the dti through their investment in the expansion of the local crushing capacity, South Africa’s soybean production reached a million tons, which was a significant milestone. One of the key strategic outputs for soybean was the successful creation of a consortium focusing on soil-borne diseases. Sclerotinia is a major disease hampering sustainable soybean production in all the different production regions. Two projects focusing on disease control of this disease was initiated in partnership with the universities of the Free State and Pretoria. A key emerging challenge for sorghum producers were the absence of new high yielding and heat tolerant cultivars for the different production regions. A strategic discussion was held between the producers and seed companies to investigate the possibility of conducting ‘field trials’ in partnership. This is a producer-driven initiative, in collaboration with the principal seed companies, to find solution for their specific production zones. This project will enable producers to identify the most suitable and adaptable cultivar for a specific region, especially for ‘new’ cultivars. CONSERVATION AGRICULTURE FARMER INNOVATION PROGRAMME Grain SA, together with The Maize and Winter Cereal Trusts, established a Conservation Agriculture Farmer Innovation Programme (CA-FIP) to address concerns about excessively high soil degradation rates, profitability and poverty in grain-producing areas. Progress and major achievements
|
STRATEGIESE NAVORSINGSFOKUSAREAS Graanprodusente besef dat navorsing en ontwikkeling én innovering belangrik is om produktiwiteit en volhoubaarheid te verbeter, en staar voortdurend nuwe uitdagings in die gesig, soos om in die vrye mark mededingend te bly. Graan SA het gewasverbetering as ‘n strategiese fokusarea geïdentifiseer, omdat saad ‘n belangrike inset is om opbrengs, en dus winsgewendheid, te verbeter. Graan SA het verder betrokke geraak by samewerking en die opbou van ons vertrouensverhouding met die staat (Departement van Landbou, Bosbou en Visserye [DLBV], die Departement van Wetenskap en Tegnologie [DWT], die Departement van Handel en Nywerheid [dti]), terwyl ons ons kommunikasie verbeter. ‘n Nasionale beleidsraamwerk vir koringnavorsing en onwikkeling word saam met DLBV ontwikkel. Die oogmerk is om navorsingsvermoë te versterk en ‘n kultuur van samewerking te ondersteun. Dit sal begrip vir ontluikende uitdagings tussen die beleidmakers en die bedryf vergroot, en die deel van inligting en ondersteuning vir bykomende befondsing aanmoedig. ‘n Paar van die belangrikste strategiese uitsette was die daarstelling van ‘n formele voortelingplatform-konsortium vir koring met DWT as ‘n sleutelvennoot. Die begunstigdes is die drie saadmaatskappye (Sensako, Pannar en die Landbounavorsingsraad [LNR]). Hierdie werk word deur die Universiteit Stellenbosch (US) geïmplementeer en deur DWT befonds. Verdere samewerking is met DWT se hulp verkry om ander belangrike koringproduserende lande internasionaal as vennote te betrek. Ons het ook daarin geslaag om privaat saadmaatskappye met openbare en internasionale befondsingsbronne/instellings te verbind om ons plaaslike koringnavorsingsagenda te versterk. Met die steun van die dti deur middel van hulle belegging in die uitbreiding van die plaaslike perskapasiteit het Suid-Afrika se sojaboonproduksie ‘n miljoen ton bereik, wat ‘n rekord is. Een van die belangrike strategiese uitsette vir sojabone was die suksesvolle stigting van ‘n konsortium wat op grondverwante siektes fokus. Sclerotinia is ‘n belangrike siekte wat volhoubare sojaboonproduksie in al die verskillende produksiestreke kniehalter. Twee projekte wat op die beheer van hierdie siekte fokus, is in vennootskap met die Universiteit van die Vrystaat en die Universiteit van Pretoria geïnisieer. ‘n Belangrike ontluikende uitdaging vir sorghumprodusente was die gebrek aan nuwe hoë-opbrengs- en hitteweerstandige kultivars vir die verskillende produksiestreke. ‘n Strategiese gesprek tussen die produsente en saadmaatskappye het plaasgevind om die moontlikheid te ondersoek om saam “veldtoetse” te doen. Dit is ‘n produsent-gedrewe inisiatief in samewerking met die vernaamste saadmaatskappye om ‘n oplossing vir hulle spesifieke produksiesones te vind. Hierdie projek sal produsente in staat stel om die geskikste en aanpasbaarste kultivar vir ‘n spesifieke streek te identifiseer – veral in die geval van “nuwe” kultivars. BOERE-INNOVERINGSPROGRAM VIR BEWARINGSLANDBOU Graan SA, het saam met die Mielie- en Wintergraantrust, ‘n Boere-innoveringsprogram vir Bewaringslandbou (BIP-BL) bekendgestel om kommer oor buitensporige hoë gronddegradasiekoerse, winsgewendheid en armoede in graanproduserende gebiede aan te spreek. Vordering en belangrikste prestasies
|
|
|
|
|
|
|
|
||
|
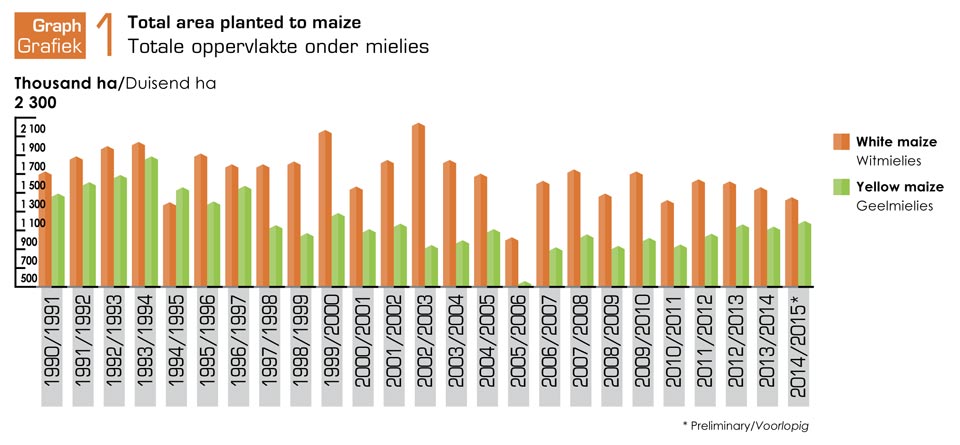
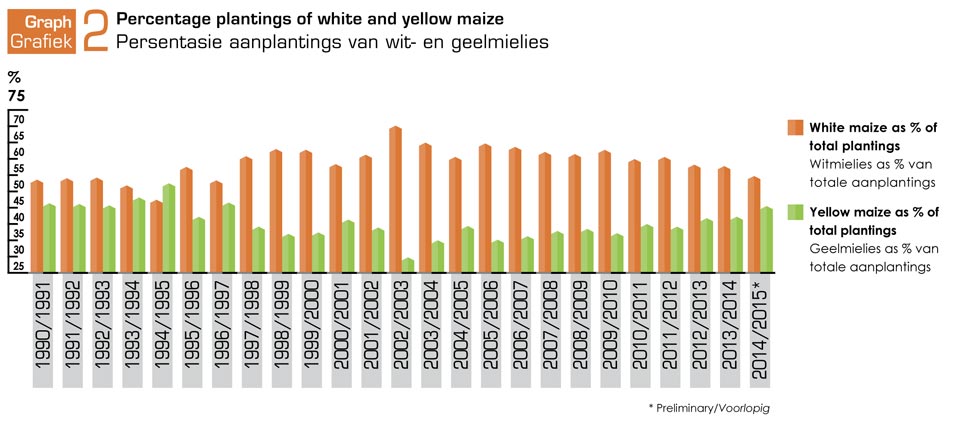
PRODUCTION CONDITIONS IN THE 2014/2015 PRODUCTION SEASON The 2014/2015 production season started out with the expectation that average to above-average harvests could realise in the summer cereal-producing areas. However, conditions changed drastically and South Africa – especially the western parts of the country – experienced an exceptionally harsh and extended midsummer drought period. The concern with respect to this midsummer drought was that South Africa’s subterranean moisture conditions in general were already under severe pressure and that this below-average rainfall would place further strain on summer cereal crops. The extreme heat and dry conditions occurred during the pollination phase of the summer crops and negatively affected yields. Rainfall occurred in the shape of thunderstorms and no widely spread rain fell. This meant that adjacent fields varied from very good to extremely poor. Maize, sunflower and sorghum plantings decreased by 1,3%, 3,8% and 10,6% respectively from the 2013/2014 production season to the 2014/2015 production season, while producers expanded their plantings of soybeans, groundnuts, sorghum and dry beans. Producers are profit driven and select their grain and oilseeds for plantings accordingly. Winter grain producers planted 1,2% more wheat and 10,1% more barley in the 2015/2016 production season than in the 2014/2015 production season, while the canola plantings decreased since last year. This reduction in canola hectares can largely be attributed to late rain in the Swartland and profit margins that were under pressure. Wheat hectares in the Free State expanded by 15,1%, while the plantings in the Western Cape were the same as last year. The barley hectares increased by 10,1%, mainly due to new barley cultivars on the market and better weather conditions in the Rûens area compared to the Swartland. MAIZE Maize plantings decreased by 1,3% from the 2013/2014 production season to the 2014/2015 production season. White maize plantings decreased by 6,6%, while the yellow maize plantings expanded by 6,0% (see Graph 1). The decrease in maize hectares can largely be attributed to the fact that profitable maize cultivation was under some pressure during planting compared to the other summer cereal crops. |
PRODUKSIE-OMSTANDIGHEDE IN DIE 2014/2015-PRODUKSIESEISOEN Die 2014/2015-produksieseisoen het afgeskop met die verwagting dat gemiddelde tot bo-gemiddelde oeste in die somergraanproduserende gebiede kan realiseer. Omstandighede het egter handomkeer verander en Suid-Afrika het deur ‘n buitengewoon strawwe en uitgerekte midsomerdroogte-periode, veral in die westelike dele van die land, gegaan. Die kommer met betrekking tot hierdie midsomerdroogte was dat Suid-Afrika se ondergrondvogtoestande oor die algemeen alreeds onder hewige druk was en dat hierdie ondergemiddelde reënval nog verdere stremming op somergraangewasse sou plaas. Die uiterste hitte en droë toestande het tydens die bestuiwingsfase van die somergewasse voorgekom en opbrengste is negatief beïnvloed. Reënval het in die vorm van donderbuie voorgekom en geen wydverspreide reën is ontvang nie. Dit het meegebring dat lande langs mekaar vanaf baie mooi tot uiters swak vertoon het. Mielie-, sonneblom- en sorghumaanplantings het onderskeidelik met 1,3%, 3,8% en 10,6% vanaf die 2013/2014-produksieseisoen tot die 2014/2015-produksieseisoen afgeneem, terwyl produsente met die aanplanting van sojabone, grondbone en droëbone uitgebrei het. Produsente is winsgedrewe en maak hul keuse van graan en oliesade vir aanplantings daarvolgens. Wintergraanprodusente het vir die 2015/2016-produksieseisoen 1,2% meer koring en 10,1% meer gars as in die 2014/2015-produksieseisoen aangeplant, terwyl die aanplantings van kanola sedert verlede jaar gedaal het. Dié afname in kanola-hektare kan grotendeels aan laat reën in die Swartland en winsmarges wat onder druk verkeer het, toegeskryf word. Koring-hektare in die Vrystaat het met 15,1% uitgebrei terwyl die aanplantings in die Wes-Kaap dieselfde as verlede jaar was. Die gars-hektare het met 10,1% toegeneem hoofsaaklik weens nuwe garskultivars in die mark asook beter weersomstandighede wat in die Rûens-gebied, teenoor die Swartland, voorgekom het. MIELIES Mielie-aanplantings het met 1,3% vanaf die 2013/2014-produksieseisoen tot die 2014/2015-produksieseisoen afgeneem. Witmielie-aanplantings het met 6,6% gedaal, terwyl die geelmielie-aanplantings met 6,0% toegeneem het (sien Grafiek 1). Die afname in mielie-hektare kan grotendeels toegeskryf word aan die feit dat winsgewende mielieverbouing relatief onder druk verkeer het, in vergelyking met die ander somergraangewasse, tydens planttyd. |
|
|
|
||
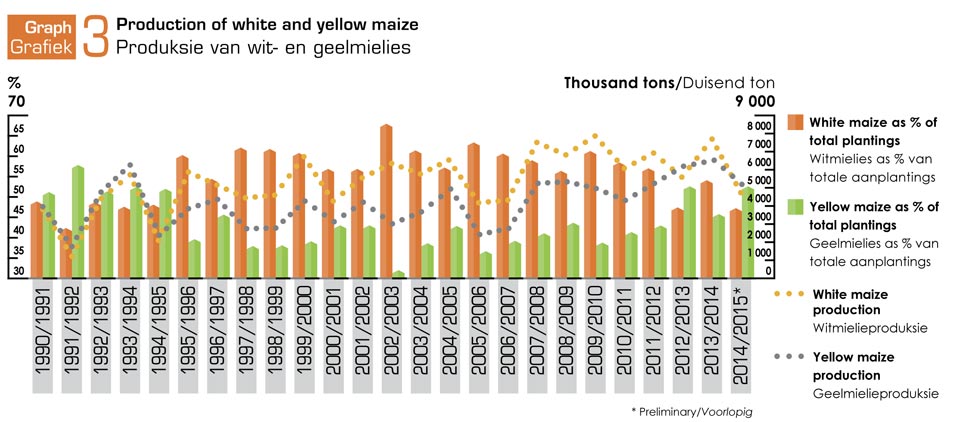
| Graph 2 indicates the ratio between white and yellow maize plantings over the past 24 years. During the 2014/2015 production season white maize constituted 54,6% and yellow maize 45,4% of the total maize area. The ratio of white maize production to that of yellow maize can be seen in Graph 3.
|
Grafiek 2 dui die verhouding tussen wit- en geelmielie-aanplantings vir die afgelope 24 jaar aan. Tydens die 2014/2015-produksieseisoen het witmielies 54,6% en geelmielies 45,4% van die totale mielie-oppervlakte uitgemaak. Die verhouding van witmielieproduksie tot dié van geelmielies kan in Grafiek 3 gesien word. | |
|
|
||
|
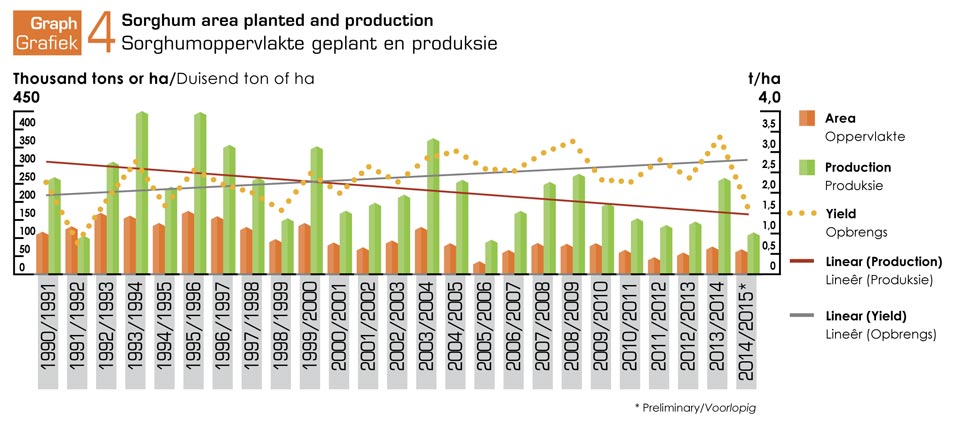
SORGHUM From Graph 4 it is clear that the planting trend of sorghum has been downwards since 1990. The sorghum area for the 2014/2015 production season was 8 350 hectares less than in the previous year. The final National Crop Estimates Committee (CEC) production estimate showed that a total of 116 500 tons of sorghum were produced during the 2014/2015 production season. While a record average national yield of 3,36 t/ha had been harvested in the previous season, a poor average yield of 1,65 t/ha was achieved in the past year, which was the second lowest in a period of 16 years. The drought had a significant impact on sorghum production, as sorghum is generally planted in marginal soils. |
SORGHUM Uit Grafiek 4 is dit duidelik dat die aanplantingstendens van sorghum sedert 1990 afwaarts is. Die sorghum-oppervlakte vir die 2014/2015-produksieseisoen is 8 350 hektaar minder as die vorige jaar. Die finale Nasionale Oesskattingskomitee (NOK)-produksieskatting toon dat ‘n totaal van 116 500 ton sorghum in die 2014/2015-produksieseisoen geproduseer is. Terwyl ‘n rekordgemiddelde nasionale opbrengs van 3,36 t/ha verlede seisoen gestroop is, is ‘n skrale gemiddelde opbrengs van 1,65 t/ha die afgelope jaar behaal wat die tweede laagste in ‘n tydperk van 16 jaar is. Die droogte het ‘n beduidende impak op sorghumproduksie gehad aangesien sorghum oor die algemeen op marginale gronde aangeplant word. |
|
|
|
||
|
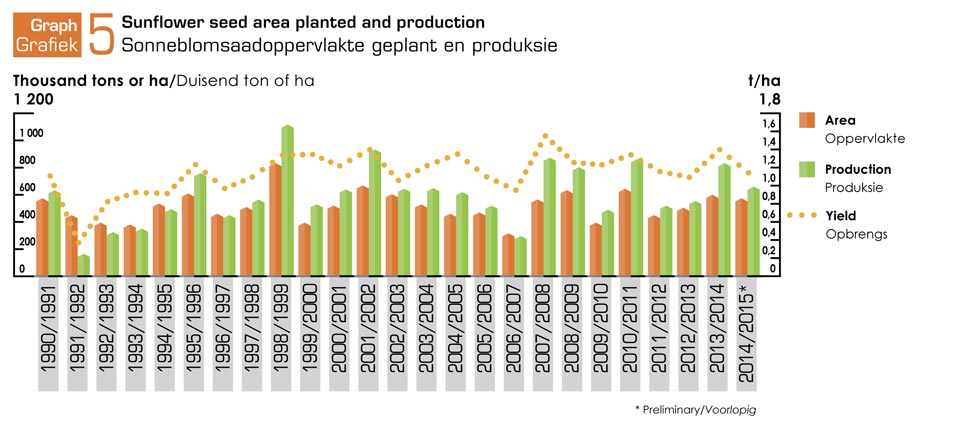
SUNFLOWER SEED Compared to the sunflower seed plantings of 598 950 hectares in the 2013/2014 production season, producers reduced the 2014/2015 production season plantings by 3,83% to 576 000 hectares. According to the CEC’s final 2015 production estimate, a crop of 660 900 tons of sunflower seed was produced and an average yield of 1,14 tons was achieved. Although extreme drought conditions occurred during the past season, the little rain that fell during March 2015 supported sunflower yields.
|
SONNEBLOMSAAD In vergelyking met die 2013/2014-produksieseisoen se sonneblomsaadaanplantings van 598 950 hektaar, het produsente hul aanplantings met 3,83% tot 576 000 hektaar verminder vir die 2014/2015-produksieseisoen. Volgens die finale 2015 NOK-produksieskatting is ‘n oes van 660 900 ton sonneblomsaad geproduseer en is ‘n gemiddelde opbrengs van 1,14 ton behaal. Alhoewel ekstreme droogtetoestande die afgelope seisoen voorgekom het, het die bietjie reën wat gedurende Maart 2015 geval het, sonneblomopbrengste ondersteun.
|
|
|
|
||
|
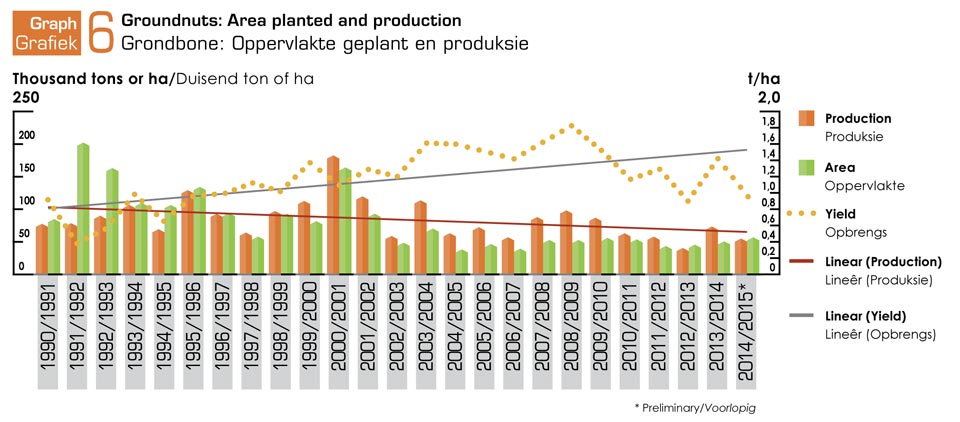
GROUNDNUTS Graph 6 shows that the area under groundnut cultivation and production has declined from 1990/1991 to 2014/2015. Factors contributing to this decline were increasing labour costs, the price ratio between groundnuts and maize, and the high capital costs of mechanising groundnut cultivation. The number of hectares increased from the 2013/2014 production season to the 2014/2015 production season, and 5 875 more hectares were planted. The average yield for the 2014/2015 production season was 0,98 t/ha, which was the second lowest yield in almost 20 years |
GRONDBONE Grafiek 6 toon dat die oppervlakte onder grondboonverbouing en -produksie van 1990/1991 tot 2014/2015 afgeneem het. Bydraende faktore tot hierdie afname is stygende arbeidskoste, die prysverhouding tussen grondbone en mielies asook die hoë kapitaalkoste om grondboonverbouing te meganiseer. ‘n Uitbreiding in hektare het vanaf die 2013/2014-produksieseisoen tot die 2014/2015-produksieseisoen plaasgevind; 5 875 meer hektare is aangeplant. Die gemiddelde opbrengs vir die 2014/2015-produksieseisoen was 0,98 t/ha, dit is die tweede swakste opbrengs in bykans 20 jaar. |
|
|
|
||
|
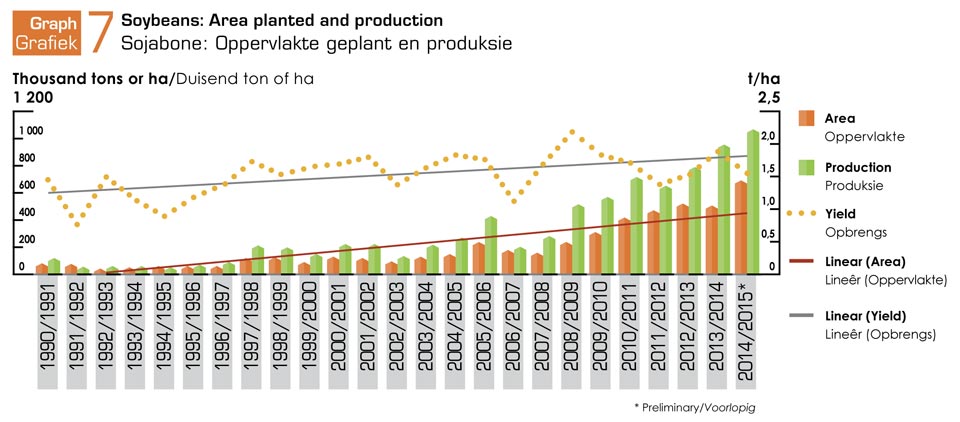
SOYBEANS In the 2014/2015 production season the area under soybeans increased by 36,7% compared to the previous season. The plantings increased by a remarkable 189,1% or 449 550 hectares over a period of seven years (since 2008/2009). According to the CEC‘s final production estimate a record crop of 1 059 850 tons was produced, which was 111 850 tons or 11,8% more than in the previous production season (Graph 7). The difficult weather conditions of the past season meant that an average yield of 1,54 t/ha was obtained, which was considerably lower than in the previous year. The soybean pressing capacity increased dramatically since a few years ago, which drastically increased the local demand for soybeans. |
SOJABONE Die oppervlakte onder sojabone het in die 2014/2015-produksieseisoen met 36,7% sedert die vorige seisoen toegeneem. Die aanplantings het oor ‘n tydperk van sewe jaar (sedert 2008/2009) met ‘n merkwaardige 189,1% of 449 550 hektaar uitgebrei. Volgens die finale NOK-produksieskatting is ‘n rekordoes van 1 059 850 ton geproduseer wat 111 850 ton of 11,8% meer as die vorige produksieseisoen is (Grafiek 7). Die moeilike weerstoestande wat die afgelope seisoen geheers het, het meegebring dat ‘n gemiddelde opbrengs van 1,54 t/ha behaal is, wat laer as die vorige jaar is. Die sojaperskapasiteit het dramaties verhoog sedert ‘n paar jaar terug, wat die plaaslike vraag na sojabone drasties verhoog. |
|
|
|
||
|
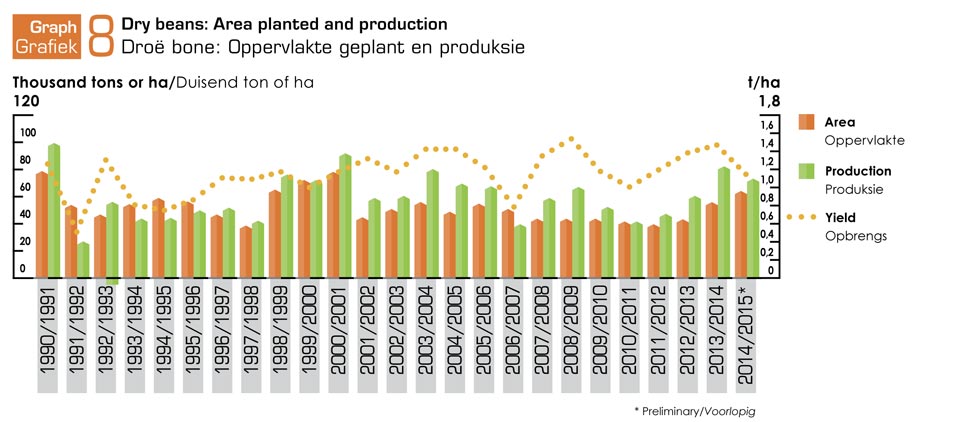
DRY BEANS During the past season, 64 000 hectares of dry beans were planted. This was an increase of 8 180 hectares compared to the previous year (Graph 8). According to the final CEC production estimate, a crop of 73 390 tons was produced, which was 10,64% less than in the 2013/2014 production season. An average yield of 1,15 t/ha was achieved, which was lower than the yields over the past three years. |
DROËBONE Daar is 64 000 hektaar droëbone die afgelope seisoen aangeplant. Dit is ‘n toename van 8 180 hektaar vergeleke met die vorige jaar (Grafiek 8). Volgens die finale NOK-produksieskatting is ‘n oes van 73 390 ton geproduseer, wat 10,64% minder as die 2013/2014-produksieseisoen is. ‘n Gemiddelde opbrengs van 1,15 t/ha is behaal, wat swakker as die afgelope drie jaar se opbrengste was. |
|
|
|
||
|
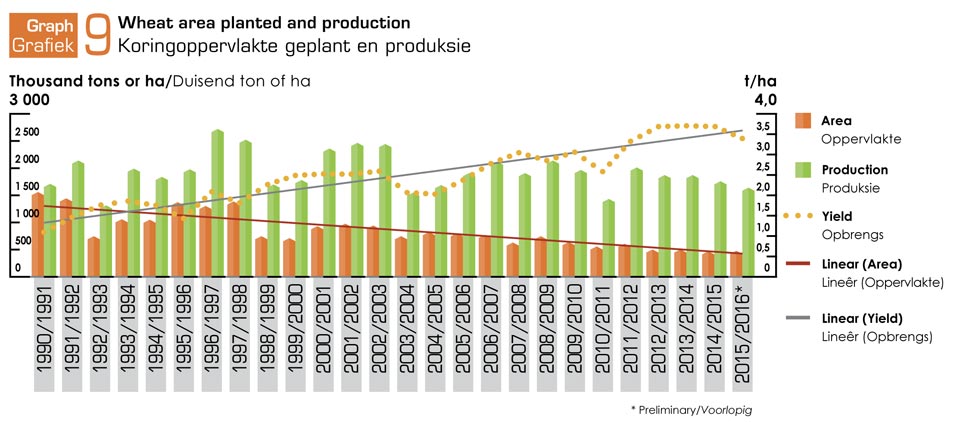
WHEAT In the 2015/2016 production season, 482 150 hectares were planted – 5 580 hectares more than in the previous season. This represented the second smallest area yet in the history of South Africa (Graph 9). According to the CEC’s second winter crop estimate for the 2015/2016 production season a wheat crop of 1,635 million tons is expected. Despite the bigger area, this is 114 600 tons less than in the previous production season. This decrease in production is largely the result of extremely dry conditions experienced in the Swartland (Western Cape). |
KORING Vir die 2015/2016-produksieseisoen is 482 150 hektaar aangeplant, wat 5 580 hektaar meer is as die vorige seisoen. Dit is die tweede kleinste oppervlakte nog in Suid-Afrika se geskiedenis (Grafiek 9). Volgens die NOK se tweede wintergewasskatting vir die 2015/2016-produksieseisoen, word ‘n 1,635 miljoen ton koringoes verwag. Ten spyte van die groter oppervlakte is dit 114 600 ton minder as die vorige produksieseisoen. Hierdie afname in produksie is grotendeels as gevolg van uiters droë toestande wat in die Swartland (Wes-Kaap) ervaar word. |
|
|
|
||
|
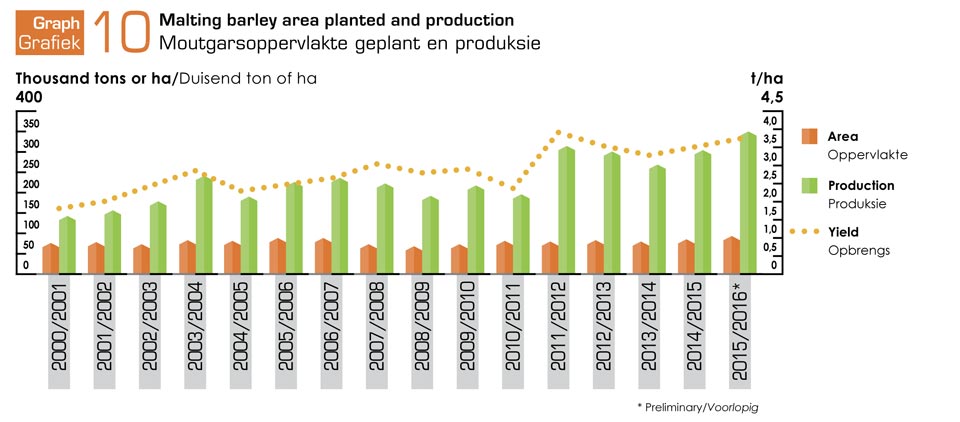
MALTING BARLEY According to the CEC, 93 730 hectares of malting barley were planted in the 2015/2016 production season. This was 10,1% or 80 605 hectares more than in the 2014/2015 production season. According to the CEC‘s second winter crop harvest estimate, 347 083 tons can be produced and a yield of 3,70 t/ha can be expected. This will be the second highest average yield yet (Graph 10). |
MOUTGARS Volgens die NOK is daar 93 730 hektaar moutgars in die 2015/2016-produksieseisoen aangeplant. Dit is 10,1% of 80 605 hektaar meer as in die 2014/2015-produksieseisoen. Volgens die NOK se tweede wintergewas-oesskatting kan 347 083 ton geproduseer word en ‘n opbrengs van 3,70 t/ha word verwag, wat die tweede hoogste gemiddelde opbrengs nóg sal wees (Grafiek 10). |
|
|
|
||
|
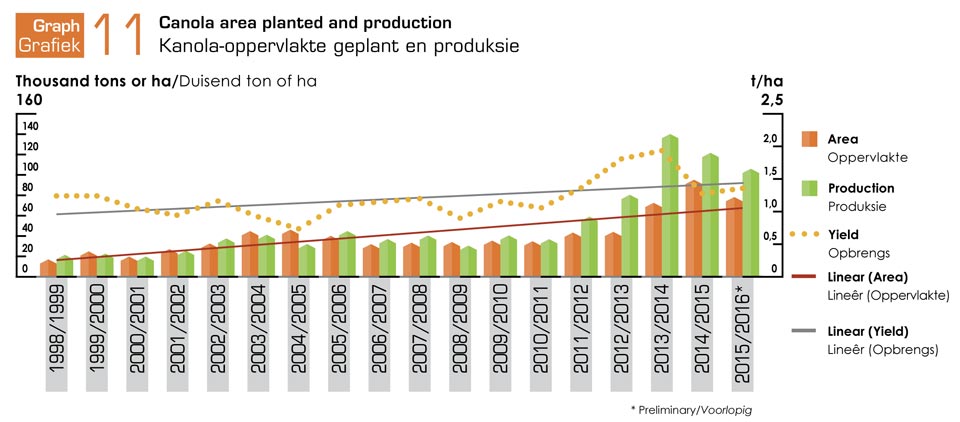
CANOLA In the 2015/2016 production season 78 050 hectares of canola were planted – a drastic 16 950 hectares fewer than in the previous season. This decrease can be largely attributed to the drought conditions during planting. According to the CEC’s second crop estimate, a harvest of 105 400 tons is expected, which is a yield of 1,35 t/ha. This will be the second biggest canola area yet in South Africa, and can be the third biggest crop produced until now (Graph 11). |
KANOLA In die 2015/2016-produksieseisoen is 78 050 hektaar kanola aangeplant, ‘n drastiese 16 950 hektaar minder as in die vorige seisoen. Hierdie afname kan grotendeels aan die droogtetoestande tydens plant toegeskryf word. Volgens die NOK se tweede oesskatting word ‘n oes van 105 400 ton verwag, wat ‘n opbrengs van 1,35 t/ha is. Dit is die tweede grootste kanola-oppervlakte nog in Suid-Afrika, en kan die derde grootste produksie wat tot nou toe geproduseer is, wees (Grafiek 11). |
|
|
|
||
|
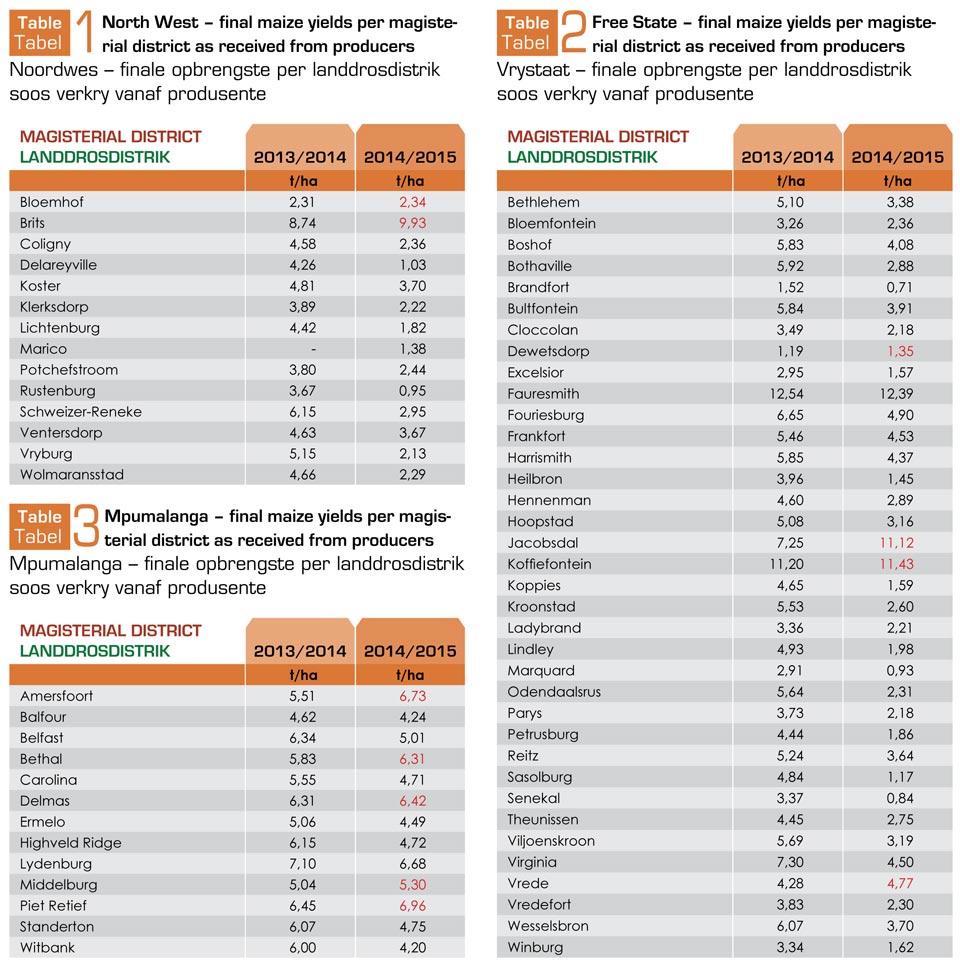
CROP ESTIMATES COMMITTEE The Crop Estimates Committee releases the additional yield information to promote the transparency of crop estimates and reinforce the credibility of the crop estimate figures. The yields per magisterial district for the different provinces are shown in Tables 1 - 3. This yield information was obtained from a sample of farmers of the Department of Agriculture, Forestry and Fisheries. The yields in red indicate that higher yields were harvested in that particular district during the 2014/2015 production season than in the previous season. |
OESSKATTINGSKOMITEE Om die deursigtigheid van oesskatting te bevorder en om die geloofwaardigheid van die oesskattingsyfers te versterk, word die addisionele opbrengsinligting deur die Oesskattingskomitee vrygestel. Die opbrengste per landdrosdistrik vir verskillende provinsies word in Tabel 1 - 3 aangetoon. Hierdie opbrengsinligting is soos verkry vanaf ‘n steekproef van produsente van die Departement van Landbou, Bosbou en Visserye. Die opbrengste wat in rooi aangedui is, dui daarop dat hoër opbrengste in daardie spesifieke distrik gedurende die 2014/2015-produksieseisoen gestroop is as wat die vorige seisoen gestroop was. |
|
|
|
||
|
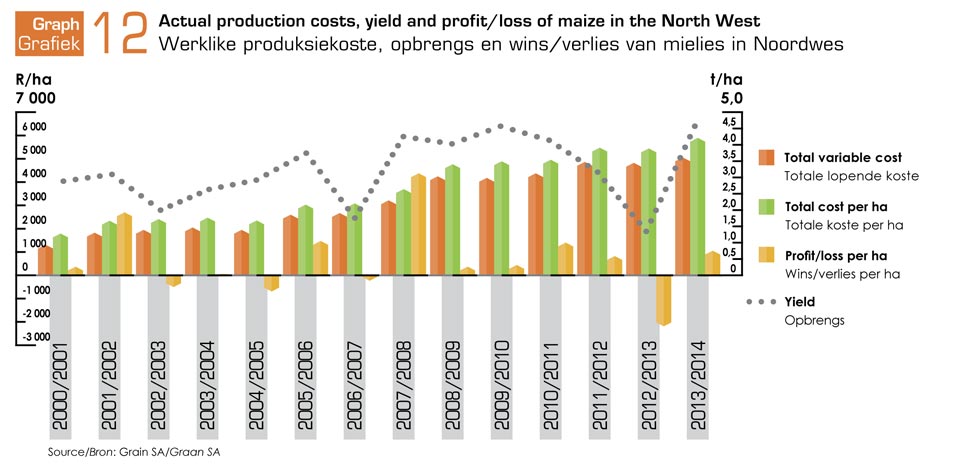
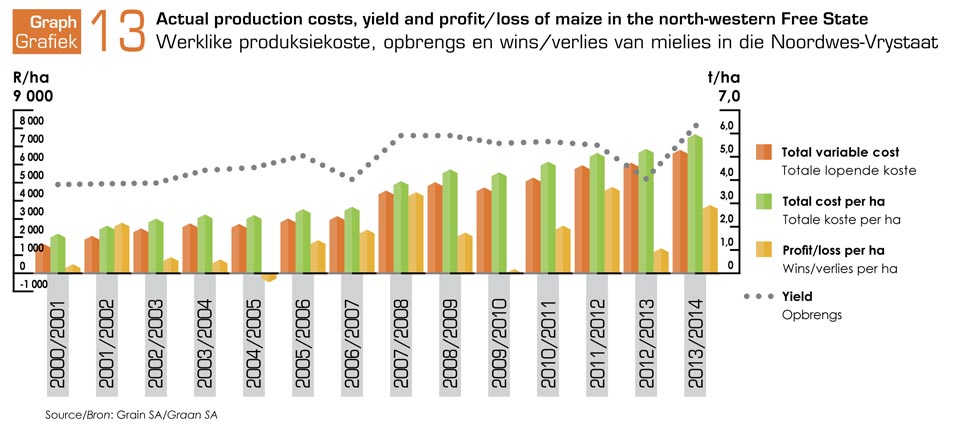
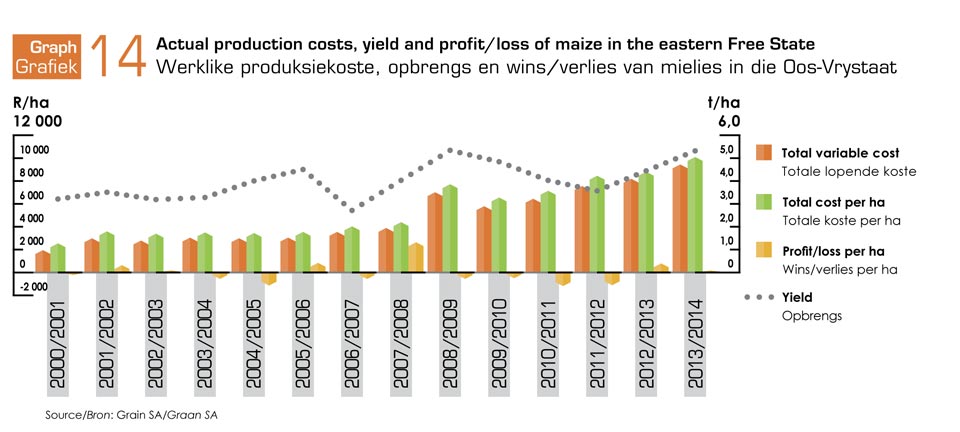
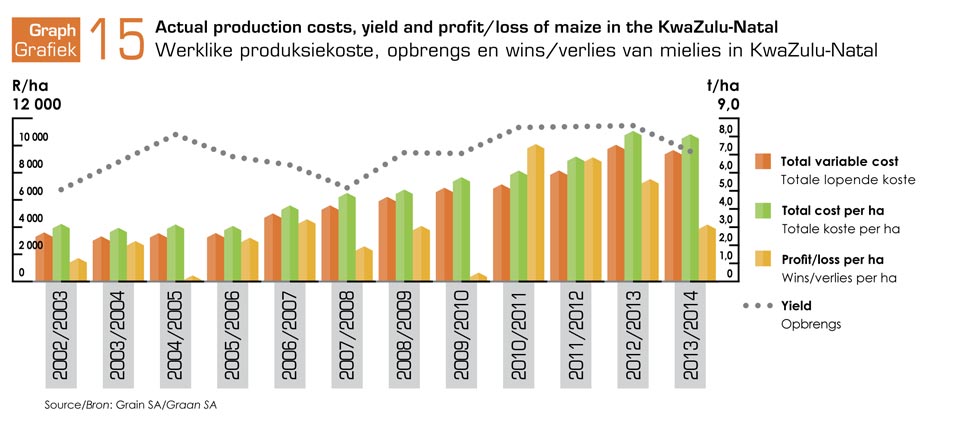
PRODUCTION COSTS PHYSICAL INCOME AND COST ANALYSIS Summer grain Determining and gathering the historic actual income and production cost figures are of the utmost importance when it comes to evaluating the profitability of any grain crop. Graphs 12 - 15 depict the actual long-term production cost, yield and profit/loss situation for North West, the north-western Free State, eastern Free State and KwaZulu-Natal since 2000/2001. It is clear that production costs are constantly increasing over time. These increases on a year-to-year basis are fairly high and have a huge impact on producers’ ability to adapt and make adjustments to their current production systems in order to plant maize profitably. From the graphs, it is clear that very good yields were obtained in specifically the western parts of the country (Graph 12 - 14) during the 2013/14 production season due to good climatic conditions. The crop conditions in KwaZulu-Natal were however challenging and the decrease in yield for that area can be seen in Graph 15. In general, South Africa produced its highest volume of maize (2014) in almost thirty years. |
PRODUKSIEKOSTE FISIESE INKOMSTE- EN KOSTE-ANALISE Somergraan Dit is uiters belangrik dat historiese werklike inkomste en produksiekostesyfers bepaal en ingesamel word wanneer die winsgewendheid van enige graangewas geëvalueer word. Grafiek 12 - 15 beeld die werklike langtermynproduksiekoste, opbrengs en wins/verlies-situasie vir die Noordwes Provinsie, Noordwes-Vrystaat, Oos-Vrystaat en KwaZulu-Natal sedert 2000/2001 uit. Dit is duidelik dat produksiekoste met verloop van tyd voortdurend styg. Hierdie stygings op ‘n jaar-tot-jaar-grondslag is redelik hoog en het ‘n groot impak op produsente se vermoë om hulle huidige produksiestelsels aan te pas en te wysig om mielies winsgewend te plant. Uit die grafieke is dit duidelik dat baie goeie opbrengste as gevolg van goeie klimaatstoestande gedurende die 2013/14 produksieseisoen behaal is, veral in die westelike dele van die land (Grafiek 12 - 14). Die gewastoestande in KwaZulu-Natal was egter ‘n uitdaging en die daling in opbrengs in daardie gebied kan in Grafiek 15 gesien word. Oor die algemeen het Suid-Afrika sy hoogste volume mielies (2014) in bykans 30 jaar geproduseer. |
|
|
|
||
|
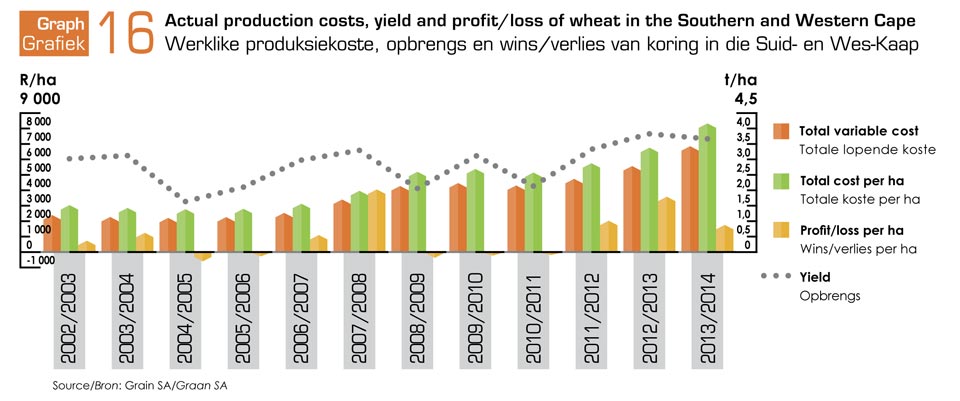
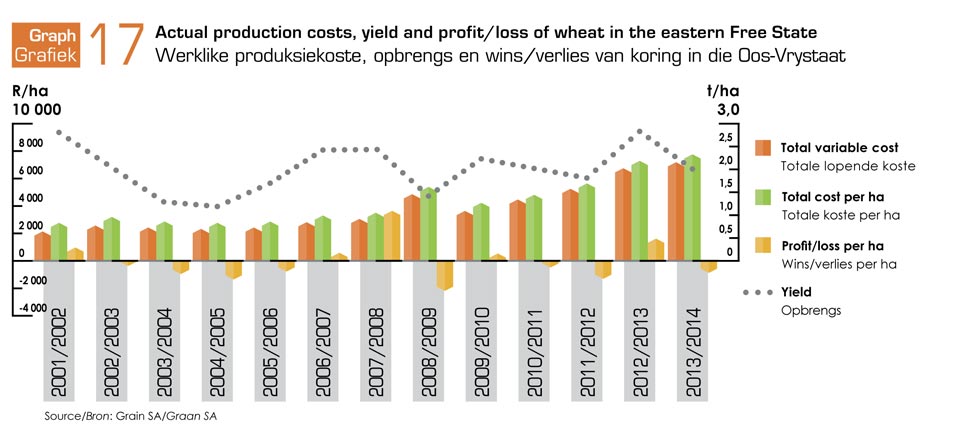
Winter grain Graphs 16 and 17 show the actual production costs, yield and profit/loss situation of wheat in the Southern Cape (Western Cape) and the eastern Free State. The graphs show that profits were made in the Southern Cape in the 2013 production season, while producers in the eastern Free State incurred losses. The 2012 season was the only one over the past five years in which producers in the eastern Free State made a profit from the planting of wheat. The main reason for the profits in the Southern Cape was the good yields obtained, while producers in the eastern Free State harvested lower yields than in the previous season, which placed profit under pressure. |
Wintergraan Grafiek 16 en 17 toon die werklike produksiekoste, opbrengs en wins/verlies-situasie van koring in die Suid-Kaap (Wes-Kaap) en die Oos-Vrystaat. Die grafieke toon dat winste in die 2013-produksieseisoen in die Suid-Kaap gemaak is, terwyl produsente in die Oos-Vrystaat verliese gemaak het. Die 2012-seisoen was die enigste jaar wat produsente in die Oos-Vrystaat, gedurende die laaste vyf jaar, ‘n wins uit die aanplant van koring gemaak het. Die belangrikste rede vir die winste in die Suid-Kaap was weens goeie opbrengste wat behaal is, waar produsente in die Oos-Vrystaat swakker opbrengste as verlede seisoen afgehaal het, wat wins onder druk geplaas het. |
|
|
|
||
|
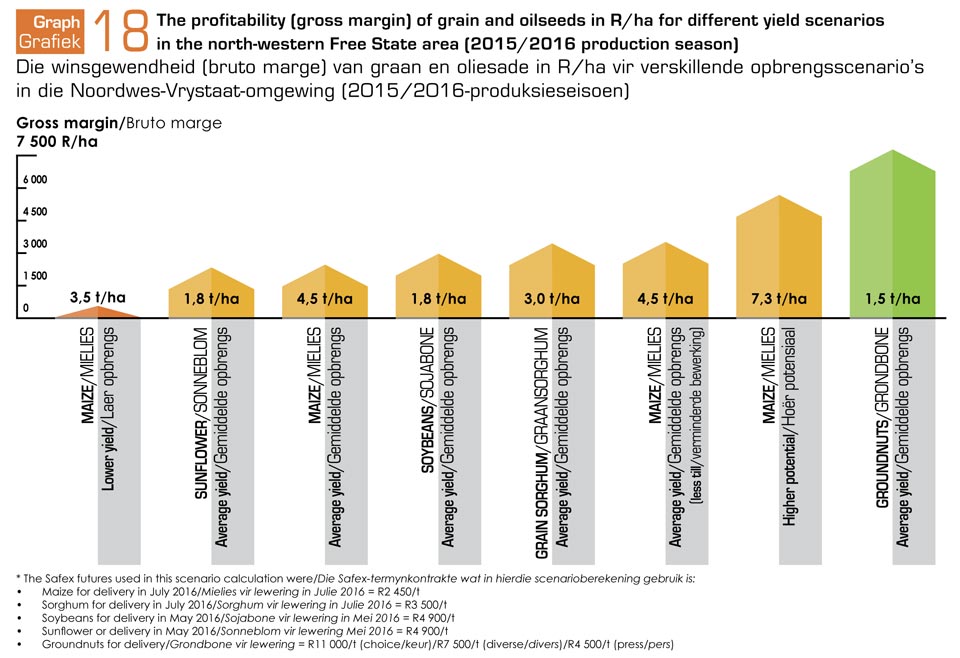
BUDGETED INCOME AND COST ANALYSIS It is vital that producers thoroughly acquaint themselves with the production costs of summer crops for the upcoming season and assess their profitability before planting them. Due to the free market, producers must decide whether the Safex price is adequate and Grain SA therefore compiles detailed enterprise budgets for the homogeneous production regions of South Africa. Only by calculating all costs can a sensible decision on sustainable production be made. The cost structure of the budget is compiled using variable and fixed costs. Producers use these budgets to compile and compare their own on-farm budgets and this information is crucial, as it is the backbone of production decisions. 2015/2016 production season The drought conditions of the past season (2014/2015) placed profitable grain and oilseed production in most parts of South Africa under major pressure. However, with the new season around the corner, the situation looks considerably better as a result of stock levels that are particularly low and that support local prices. This increase in producer prices that has occurred with most summer crops, but specifically with maize, over the past year has led to producers being able to plan with better profitability prospects regarding the crops that can be planted. The profitability (gross margin per hectare and per ton) of different maize yield scenarios as well as other grain and oilseed crops planted in the north-western Free State area is indicated in Graph 18, as applicable to the 2015/2016 production season. The yield scenarios are based on assumptions of production conditions in the north-western Free State and it is important to note that these figures may differ between producers. The calculated variable cost for each scenario as well as a calculated fixed cost of ± R2 200 was used to compile these figures. Note: Although the information in the next section is shown only for the north-western Free State area, it is available for the other regions as well. The comparative analysis (Graph 18) demonstrates that groundnuts display the best gross margin for the coming production season. If we focus on maize it is clear that the higher potential yield soils and the reduced tillage practices (five years) provide better margins than the maize in lower and average potential yield soils. With local maize prices being supported as a result of low stock levels, the profitability picture for maize compared to other crops looks much better that in the previous season, when maize was in a strong cost-squeeze situation. Producers should ensure that they have a sorghum contract before they decide to plant sorghum. They should also be aware that the biofuel plants are not yet in production and that they therefore should not produce for that market yet. |
BEGROTE INKOMSTE- EN KOSTE-ANALISE Dit is noodsaaklik dat produsente hulself deeglik van die produksiekoste van somergewasse vir die komende seisoen moet vergewis en die winsgewendheid daarvan evalueer voordat geplant word. As gevolg van die vryemark moet produsente besluit of die Safex-prys voldoende is, en Graan SA stel dus gedetailleerde ondernemingsbegrotings vir die homogene produksiestreke van Suid-Afrika op. Slegs deur alle koste te bereken, kan ‘dalk ingeligte besluit oor volhoubare produksie geneem word. Die kostestruktuur van die begroting word op grond van veranderlike en vaste koste saamgestel. Produsente gebruik hierdie begrotings om hul begrotings op die plaas saam te stel en te vergelyk, en hierdie inligting is noodsaaklik, aangesien dit die ruggraat van produksiebesluite is. 2015/2016-produksieseisoen Die afgelope seisoen se droogtetoestande (2014/2015) het winsgewende graan- en oliesaadproduksie in die grootste dele van Suid-Afrika onder hewige druk geplaas. Met die nuwe seisoen om die draai, lyk die situasie egter heelwat beter as gevolg van voorraadvlakke wat besonder laag is en plaaslike pryse ondersteun. Dié styging van produsentepryse wat by die meeste van die somergewasse, maar spesifiek mielies, die afgelope jaar voorgekom het, het tot gevolg dat produsente met beter vooruitsigte ten opsigte van winsgewendheid kan beplan watter gewasse aangeplant kan word. Die winsgewendheid (bruto marge per hektaar en per ton) van verskillende mielie-opbrengsscenario’s asook ander graan- en oliesadegewasse wat in die Noordwes-Vrystaat geplant word, word in Grafiek 18 getoon, soos dit op die 2015/2016-produksieseisoen van toepassing is. Die opbrengsscenario’s is gegrond op aannames van produksietoestande in die Noordwes-Vrystaat en dit is belangrik om daarop te let dat hierdie syfers tussen produsente kan verskil. Die berekende veranderlike koste vir elke scenario asook die berekende vaste koste van ± R2 200 is gebruik om hierdie syfers saam te stel. Let wel: Hoewel die inligting in die volgende gedeelte slegs vir die Noordwes-Vrystaat-produksiegebied getoon word, is dit ook vir die ander streke beskikbaar. Met die uitbeelding van die vergelykende analise (Grafiek 18 ), kan daar gesien word dat grondbone die beste bruto marge vir die komende produksieseisoen toon. Word daar op mielies gefokus, is dit duidelik dat die hoër potensiële opbrengsgronde en die verminderde bewerkingspraktyke (vyf jaar) beter marges as die mielies op laer- en gemiddelde potensiaal opbrengsgronde lewer. Met plaaslike mieliepryse wat as gevolg van lae voorraadvlakke ondersteun word, lyk die prentjie van mielies se winsgewendheid teenoor die ander gewasse baie beter in vergelyking met die vorige seisoen waar mielies in ‘n sterk koste-knyptangsituasie was. Produsente moet seker maak dat hulle ‘n sorghumkontrak het voordat hulle besluit om sorghum aan te plant. Kennis moet verder geneem word dat die biobrandstofaanlegte nog nie in produksie is nie en daar dus nie alreeds vir daardie mark geproduseer moet word nie. |
|
|
|
||
|
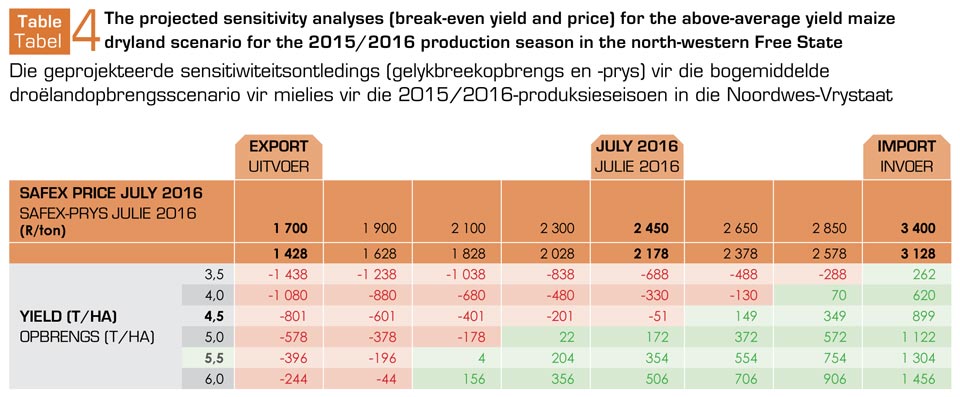
Sensitivity analyses The projected sensitivity analyses (break-even yield and price) for the above average yield maize dry land scenario for the 2015/2016 production season in the north-western Free State is shown in Table 4. During the drafting of the budget the July 2016 Safex maize price traded on average at R2 450/ton, which is approximately R2 178/ton in the producer's pocket after considering the location differential, handling costs and marketing commission. The estimated production costs of a 4,5 t/ha yield was used during compilation. The total variable costs to plant a hectare of maize for a 4,5 t/ha yield is about R7 831/ha. In addition, a calculated fixed cost component (for example salaries, rent, cost of living, electricity, etc.) of R2 200/ha added to a total production cost of R10 031/ha. If the Safex price should realise at the estimated budgeted input cost (fixed plus variable costs) a producer should harvest at least 4,5 t/ha to break even. By only taking into account the variable costs (excluding fixed costs), a producer must yield more than 3,5 t/ha to break-even. This table highlights that producers’ profitability situation looks better than last year mainly due to the higher maize prices after the recent drought.
|
Sensitiwiteitsontledings Die geprojekteerde sensitiwiteitsontledings (gelykbreekopbrengs en -prys) vir die bogemiddelde-opbrengs droëlandscenario vir mielies vir die 2015/2016-produksieseisoen in die Noordwes-Vrystaat word in Tabel 4 getoon. Met die opstel van die begroting was die Julie 2016 Safex-mielieprys gemiddeld R2 450/ton, wat ongeveer R2 178/ton in die produsent se sak is nadat die liggingsdifferensiaal, hanteringskoste en bemarkingskommissie in ag geneem is. Die geraamde produksiekoste van ‘n opbrengs van 4,5 t/ha is met die samestelling gebruik. Die totale veranderlike koste om ‘n hektaar mielies vir ‘n opbrengs van 4,5 t/ha te plant, is ongeveer R7 831/ha. ‘n Berekende vastekoste-komponent (byvoorbeeld salarisse, huur, lewenskoste, elektrisiteit, ensovoorts) van R2 200/ha moet verder by ‘n totale produksiekoste van R10 031/ha gevoeg word. Indien die Safex-prys teen die geraamde begrote insetkoste (vaste plus veranderlike koste) realiseer, moet ‘n produsent ten minste 4,5 t/ha oes om gelyk te breek. Indien slegs die veranderlike koste (vaste koste uitgesluit) in ag geneem word, moet ‘n produsent se opbrengs meer as 3,5 t/ha wees as hy wil gelykbreek. Hierdie tabel beklemtoon dat produsente se winsgewendheidsituasie beter as verlede jaar lyk, hoofsaaklik as gevolg van hoër mieliepryse na die onlangse droogte.
|
|
|
|
||
Publication: December 2015
Section: Industry Services