- Follow us:
- Our Commodities:
-
March 2012
PETRU FOURIE, ECONOMIST: INDUSTRY SERVICES, GRAIN SA AND CORNÉ LOUW, SENIOR ECONOMIST: INDUSTRY SERVICES, GRAIN SA
Since the same time last year, the current and preseason contract prices for wheat weakened. This decline, as well as the increasing input costs, placed the profitability of wheat production under pressure. In this article the wheat/input terms of trade and the budgeted profitability for the 2012/2013 production season, is examined closely.
Wheat/urea terms of trade
Graph 1 indicates the amount of wheat that is needed to purchase 1 ton of urea from 1990 until 2012. For the 2012/2013 season (coming season) the Safex December 2012 (R2 858) wheat contract is used to calculate the producer price.
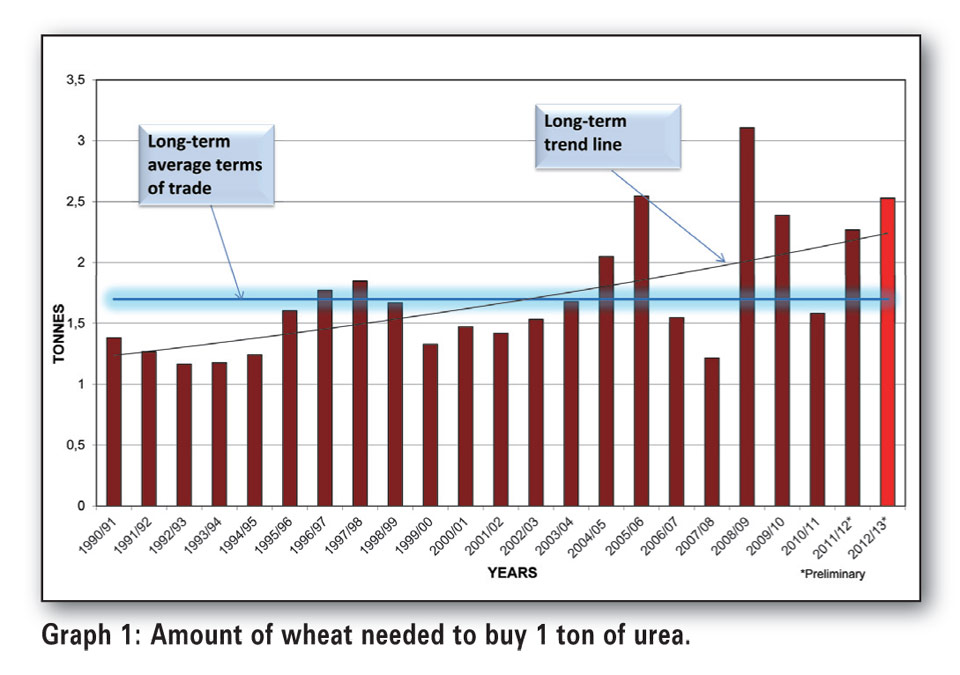
From the graph it is clear (see the trend line) that the terms of trade declined dramatically since 1990. It is also clear that the wheat/urea terms of trade improved since the 2008/2009 season, but the expected terms of trade for the coming season is weaker than the previous three years and that a terms of trade of 2,5 tonnes of wheat is currently needed for 1 ton urea.
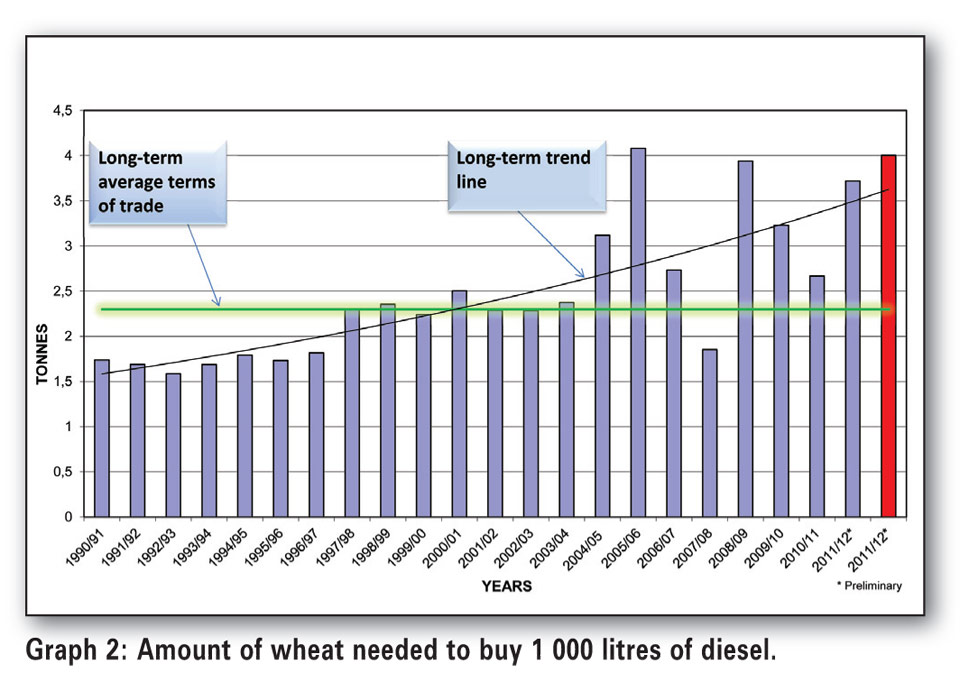
Wheat/diesel terms of trade
Graph 2 illustrates how much wheat is needed to purchase 1 000 litres of diesel. From the graph (trend line) one can see that the wheat/diesel terms of trade declined dramatically since 1990. The long-term average terms of trade is 2,7 tonnes of wheat for 1 000 litres of diesel, while the expected terms of trade for the coming season is 4 tonnes. These terms of trade declined a great deal since five years ago (2007/2008 production season) when the terms of trade was 1,9 tonnes of wheat for 1 000 litres of diesel.
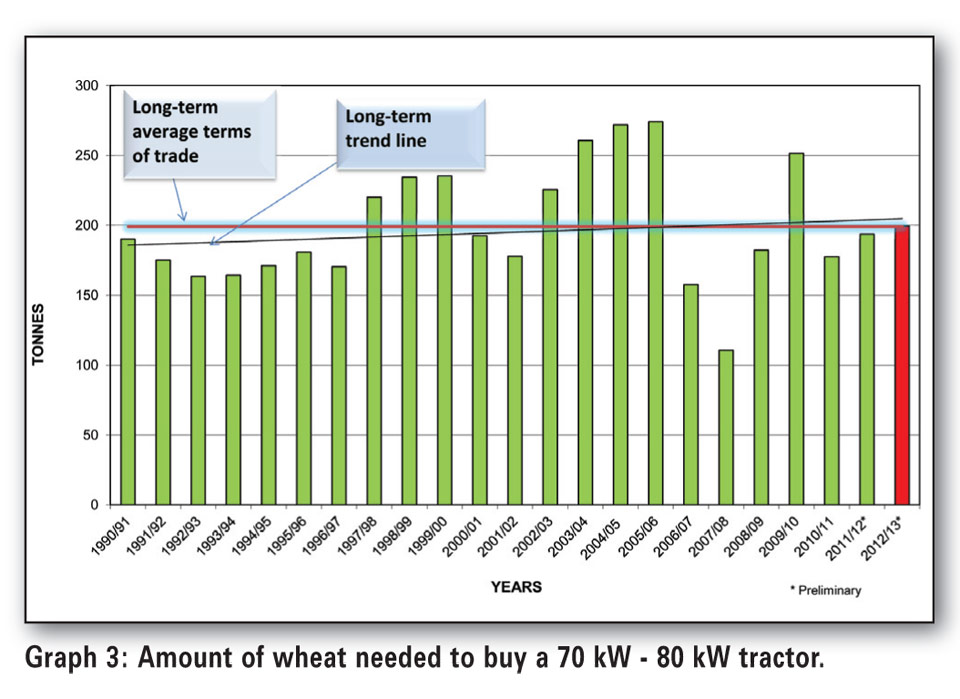
Wheat/tractor terms of trade
Graph 3 indicates how much wheat is needed to purchase a tractor of between 70 kW and 80 kW. The average wheat/tractor terms of trade since 1990 is 199 tonnes of wheat, while the expected terms of trade for the coming season will be more or less the same amount of tonnes.
How does this affect the profitability of wheat production?
To indicate the input price increases and changes in grain prices, the Grain SA planning model was used. In these models, the general practises, average amounts and prices at farm level are discounted.
During the compilation of these budgets, the expected prices were used and thus many changes can still occur. By adjusting last year’s input prices to the current prices, the effect of price increases can be calculated. The western Rûens was used to base the calculations on.
In Table 1 the effects of the year-on-year price increases for wheat is indicated. Here the budget as prepared for the 2011/2012 and the 2012/2013 production season are compared to indicate the differences.
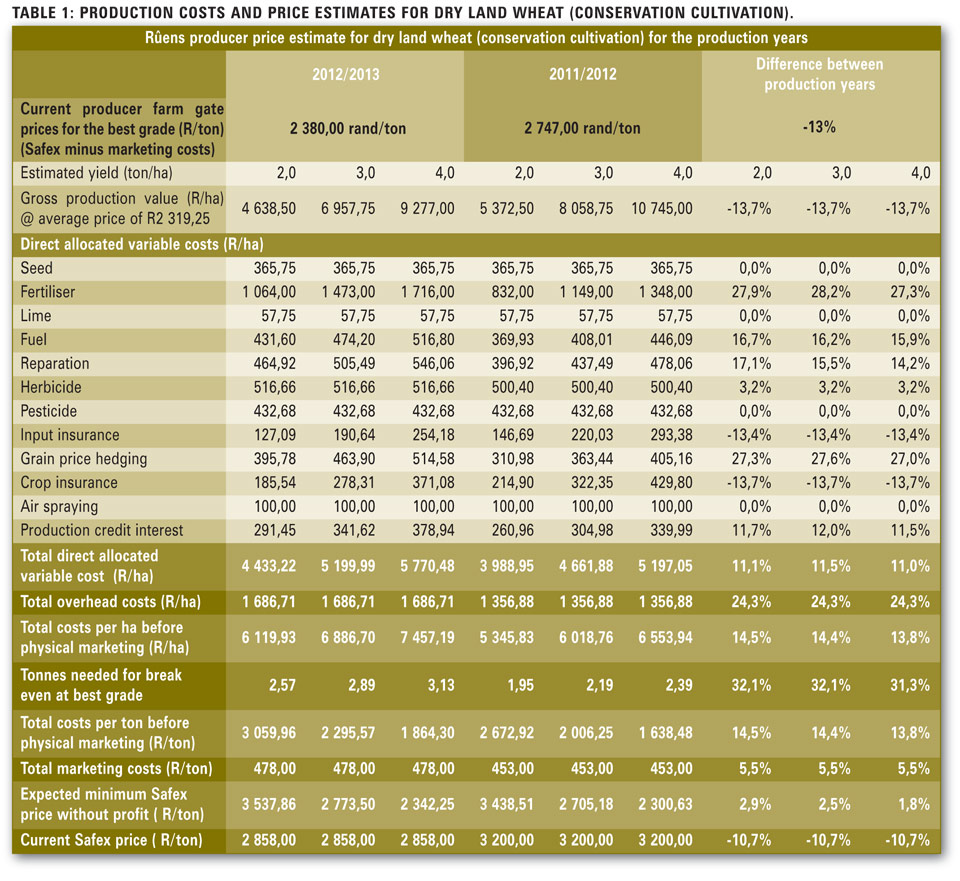
As indicated in Table 1, producers should take care before new crops are planted. The direct apportionable variable cost since the 2011/2012 production season increased on average by 11% for the 2012/2013 production season.
Fertiliser and diesel in particular increased since last year. The total wheat costs per hectare increased between 13,8% and 14,5% with the overhead costs that also contributed a lot. Producers should continue to strive to be more effective and to apply inputs optimally.
In summary
Given the current input prices and current preseason contracts, producers will have to plan very well. Taking into account the rate at which product prices have declined, together with the increasing input prices, producers should make their calculations thoroughly before planting.
Producers should also ensure that the “correct price” is paid for an input; thus make certain that the best possible price is paid for an input, given the quality. Do not merely accept the first price at face value. Contact Grain SA on 08600 47246 for the latest input prices and production costs calculations.
Publication: March 2012
Section: Input Overview
