- Follow us:
- Our Commodities:
-
August 2016
JOLANDA NORTJÉ, manager: Laboratory, The Southern African Grain Laboratory NPC
The 2014/2015 production season was extremely trying for producers. Despite this fact, the highest South African soybean crop ever, namely 1 070 000 tons, was produced. The area utilised for soybean production increased from 502 900 hectares in the previous season to 687 300 hectares this season.
The significant impact of the drought experienced this season, is shown by comparing the 37% increase in area, with the 13% increase in production, resulting in a yield decrease of 1,89 t/ha in 2013/2014 to 1,56 t/ha. The major soybean producing provinces, contributing 72,5% of the total crop, were the Free State and Mpumalanga.
During the harvesting season, a representative sample of each delivery of soybeans at the various silos was taken according to the prescribed grading regulations. 150 composite soybean samples, representing the different production regions, were analysed for quality. These samples represent the fourth annual soybean crop quality survey.
Summary of results
Full grading was done in accordance with the regulations relating to the Grading, Packing and Marking of Soybeans intended for sale in the Republic of South Africa (No. R 478 of 20 June 2014) as well as Industry-wide dispensations Ref No. 20.4.14.1 dated 6 March 2015 and 12 March 2015 regarding the use of the 1,8 mm slotted sieve and the 4,75 mm round hole sieve during the grading of soybeans.
87% (131) of the 150 samples analysed were graded as Grade SB1 and 19 of the samples were downgraded to class other soybeans (COSB). During the previous two seasons, 12% (2013/2014) and 5% (2012/2013) of the samples were downgraded to class other soybeans.
The majority of the samples were downgraded as a result of either the presence of poisonous seeds exceeding the maximum permissible number of either one per 1 000 g or seven per 1 000 g or as a result of the percentage of other grain present in the samples exceeding the maximum permissible deviation of 0,5%.
According to the South African soybean grading regulations, the determination of the percentage wet pods in a consignment shall be done on a working sample of at least 10 kg of soybeans from a representative sample of the consignment. Due to practical considerations the samples received at the Southern African Grain Laboratory (SAGL) from the grain storage companies is typically ± 5 kg.
Pods were found in 22 of the 150 samples graded, all of these pods were dry on receival at the SAGL. The percentage of these pods in the samples ranged from 0,14% to 0,63% based on a working sample size of at least 200 g. Eleven samples contained pods, not identifiable as wet pods according to the definition, in percentages exceeding the wet pod maximum permissible deviation of 0,2%.
Based on the samples received for this crop survey, Sclerotinia did not pose any problems. The highest percentage of Sclerotinia observed (0,20%) was on a sample from Mpumalanga, which is well below the maximum permissible level of 4%. During this season, the samples from the Northern Cape had the highest weighted average percentage Sclerotinia (0,07%). The national weighted average percentage this season was 0,01% compared to the 0,03% of the previous three seasons.
Limpopo's two samples had the highest average percentage foreign matter. The weighted average percentage foreign matter in the rest of the samples ranged from 0,54 in the Northern Cape to 0,95 in the North West Province.
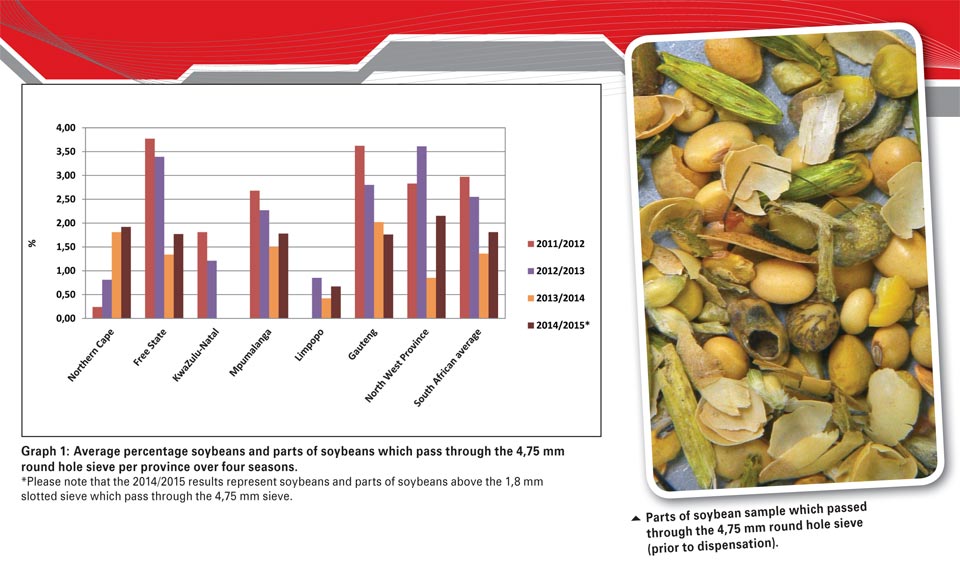
The North West Province (18 samples) reported the highest weighted average percentage soybeans and parts of soybeans above the 1,8 mm slotted sieve which pass through the 4,75 mm round hole sieve, namely 2,15% and Limpopo (two samples) the lowest at 0,67%.
Mpumalanga, with the highest number of samples (77), reported an average of 1,78%. The Free State averaged 1,77% (42 samples). The national weighted average percentage increased from 1,36% last season to 1,81% this season. No samples were received from KwaZulu-Natal for the 2013/2014 and 2014/2015 seasons. See Graph 1 and Graph 2.
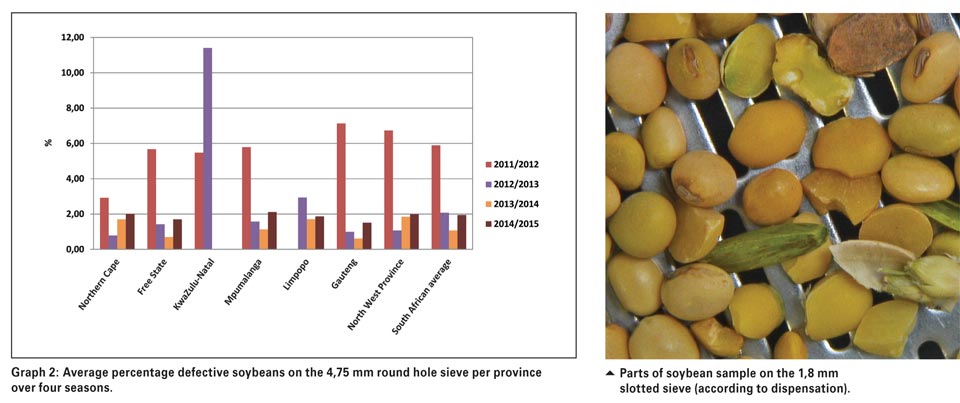
Eight samples were submitted from Gauteng and the lowest weighted average percentage defective soybeans on the 4,75 mm sieve were reported on these, namely 1,51%. Mpumalanga reported the highest percentage of 2,12, followed by the Northern Cape and the North West Province with 2% and 1,99% respectively. The national weighted average increased from 1,07% in the previous season to 1,95% this season.
The South African weighted average percentage soiled soybeans of 0,77% was lower than the 0,89% of the previous season but higher than the weighted average (0,41%) of the 2012/2013 season. Average weighted percentages per province ranged from 0,38 in the Northern Cape to 1,43 in Limpopo. This season one sample from Mpumalanga had a soiled soybean percentage exceeding the maximum permissible deviation of 10%, none above the limit were observed during the 2013/2014 season.
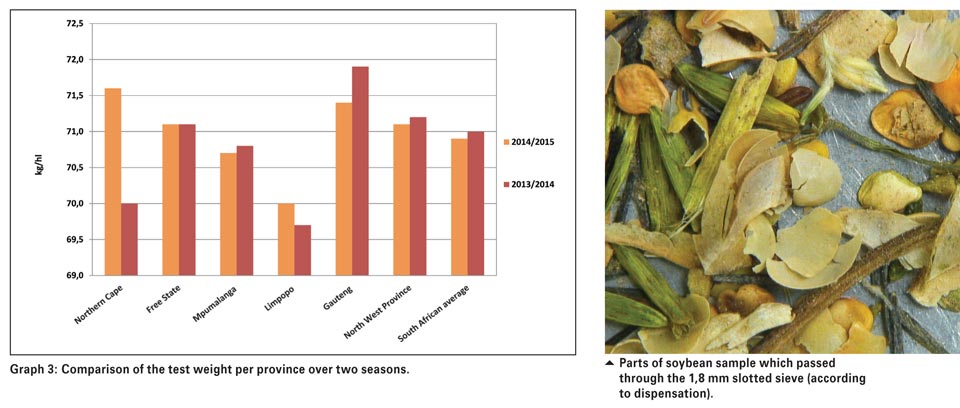
Test weight provides a measure of the bulk density of grain and oilseeds and does not form part of the grading regulations for soybeans in South Africa. An approximation of the test weight of South African soybeans is done by determining the g/1 L filling weight of the 150 soybeans samples by means of the Kern 222 apparatus.
The test weight was extrapolated by means of the following formulas obtained from the Test Weight Conversion Chart for Soybean of the Canadian Grain Commission: y = 0,1898x + 2,2988 (291 to 350 g/0,5 L) and y = 0,1895x + 2,3964 (351 to 410 g/0,5 L). The national weighted average test weight was 70,9 kg/hl and ranged from 63,3 kg/hl to 78,2 kg/hl. The national average the previous season was 71 kg/hl, varying between 66,6 kg/hl and 74,7 kg/hl. The highest weighted provincial average was reported for the samples from the Northern Cape and the lowest for the samples from Limpopo.
The EnviroLogix QuickComb kit for bulk soybeans was used to quantitatively determine the presence of genetically modified soybeans. The kit is designed to extract and detect the presence of certain proteins at the levels typically expressed in genetically modified bulk soybeans. 15 of the crop samples were screened to test for the presence of CP4 EPSPS (Roundup Ready) and all samples tested positive.
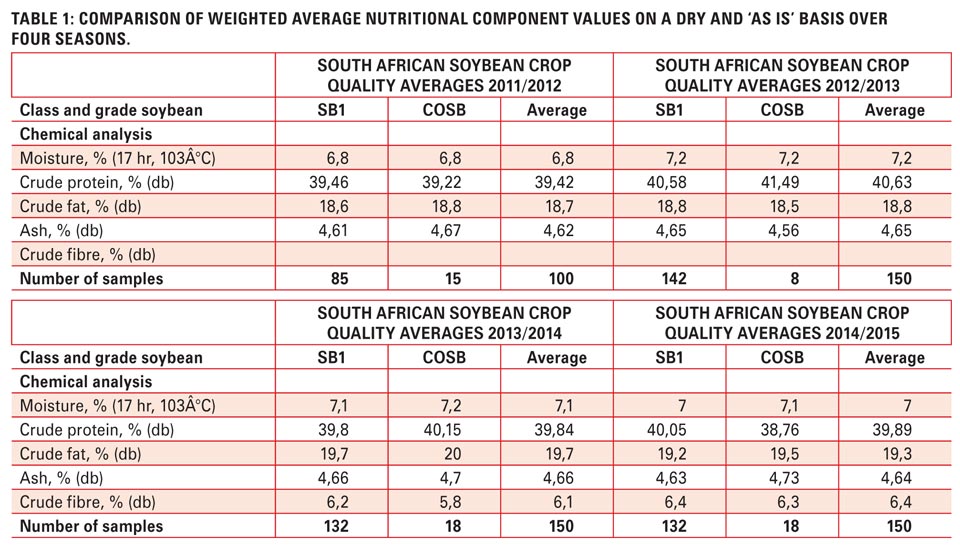
All the soybean samples were milled on a Retch ZM 200 mill fitted with a 1 mm screen, prior to the nutritional component analyses. The crude protein, fat, fibre and ash are reported on a dry/moisture-free basis (db) for the purposes of the survey. For comparison purposes however, the national 'as is' basis results are provided in Table 1. These 'as is' values were calculated using the weighted national average values.
The moisture results used in this calculation was determined by means of the method prescribed under the ISTA International Rules for Seed Testing, Section 9, latest edition whereby the moisture content is determined as a loss in weight of a sample when dried in an oven at 103°C for 17 hours.
The Dumas combustion analysis technique was used to determine the crude protein content, according to AACCI method 46-30.01 latest edition. Combustion at high temperature in pure oxygen sets nitrogen free, which is measured by thermal conductivity detection. The total nitrogen content of the sample is determined and converted to equivalent protein by multiplication with a factor of 6,25 to obtain the crude protein content. The weighted average crude protein content this season was 39,89%, comparing very well with the 39,84% of the previous season. Mpumalanga showed the highest weighted average crude protein content of 40,44% and Limpopo the lowest of 36,16%.
The weighted average crude fat percentage decreased from 19,7% in 2013/2014, to 19,3% this season. The samples from Limpopo had the highest weighted average crude fat content of 23,6%. The lowest average fat contents were observed in Gauteng with 18,9%. The fat is extracted from the sample by petroleum ether with the aid of the Soxhlet extraction apparatus, followed by the removal of the solvent by evaporation and weighing the dried residue thus obtained.
Ash is defined as the quantity of mineral matter which remains as incombustible residue of the tested substance, after application of the described working method. SAGL uses an in-house method, based on the AACCI 08-02.01 Rapid (magnesium acetate) method. The samples were incinerated at 700 ± 10°C in a muffle furnace for 45 minutes.
The national weighted average ash content did not vary significantly over the four seasons that this survey has been conducted, 4,64% this season compared to the 4,66%, 4,65% and 4,62% for the previous three seasons. Samples from the Northern Cape and Limpopo tend to show higher ash contents over seasons.
The weighted average percentage crude fibre varied from 4,9% in Limpopo to 7,5% in the Northern Cape. The South African weighted average was slightly higher this season (6,4%), 6,1% the previous season.
The in-house method used determines crude fibre as the loss on ignition of the dried residue remaining after digestion of the sample with 1,25% sulphuric acid (H2SO4) and 1,25% sodium hydroxide (NaOH) solutions under specific conditions.
The results of this survey are available on the SAGL website (www.sagl.co.za). The hard copy reports are distributed to all the directly affected groups and interested parties. The report is also available for download in a PDF-format from the website.
With gratitude to the Oil and Protein Seed Development Trust for financial support of these annual surveys and to the members of Agbiz Grain for providing the crop samples.
Publication: August 2016
Section: Focus on
