


 105 / 116

103
August 2015
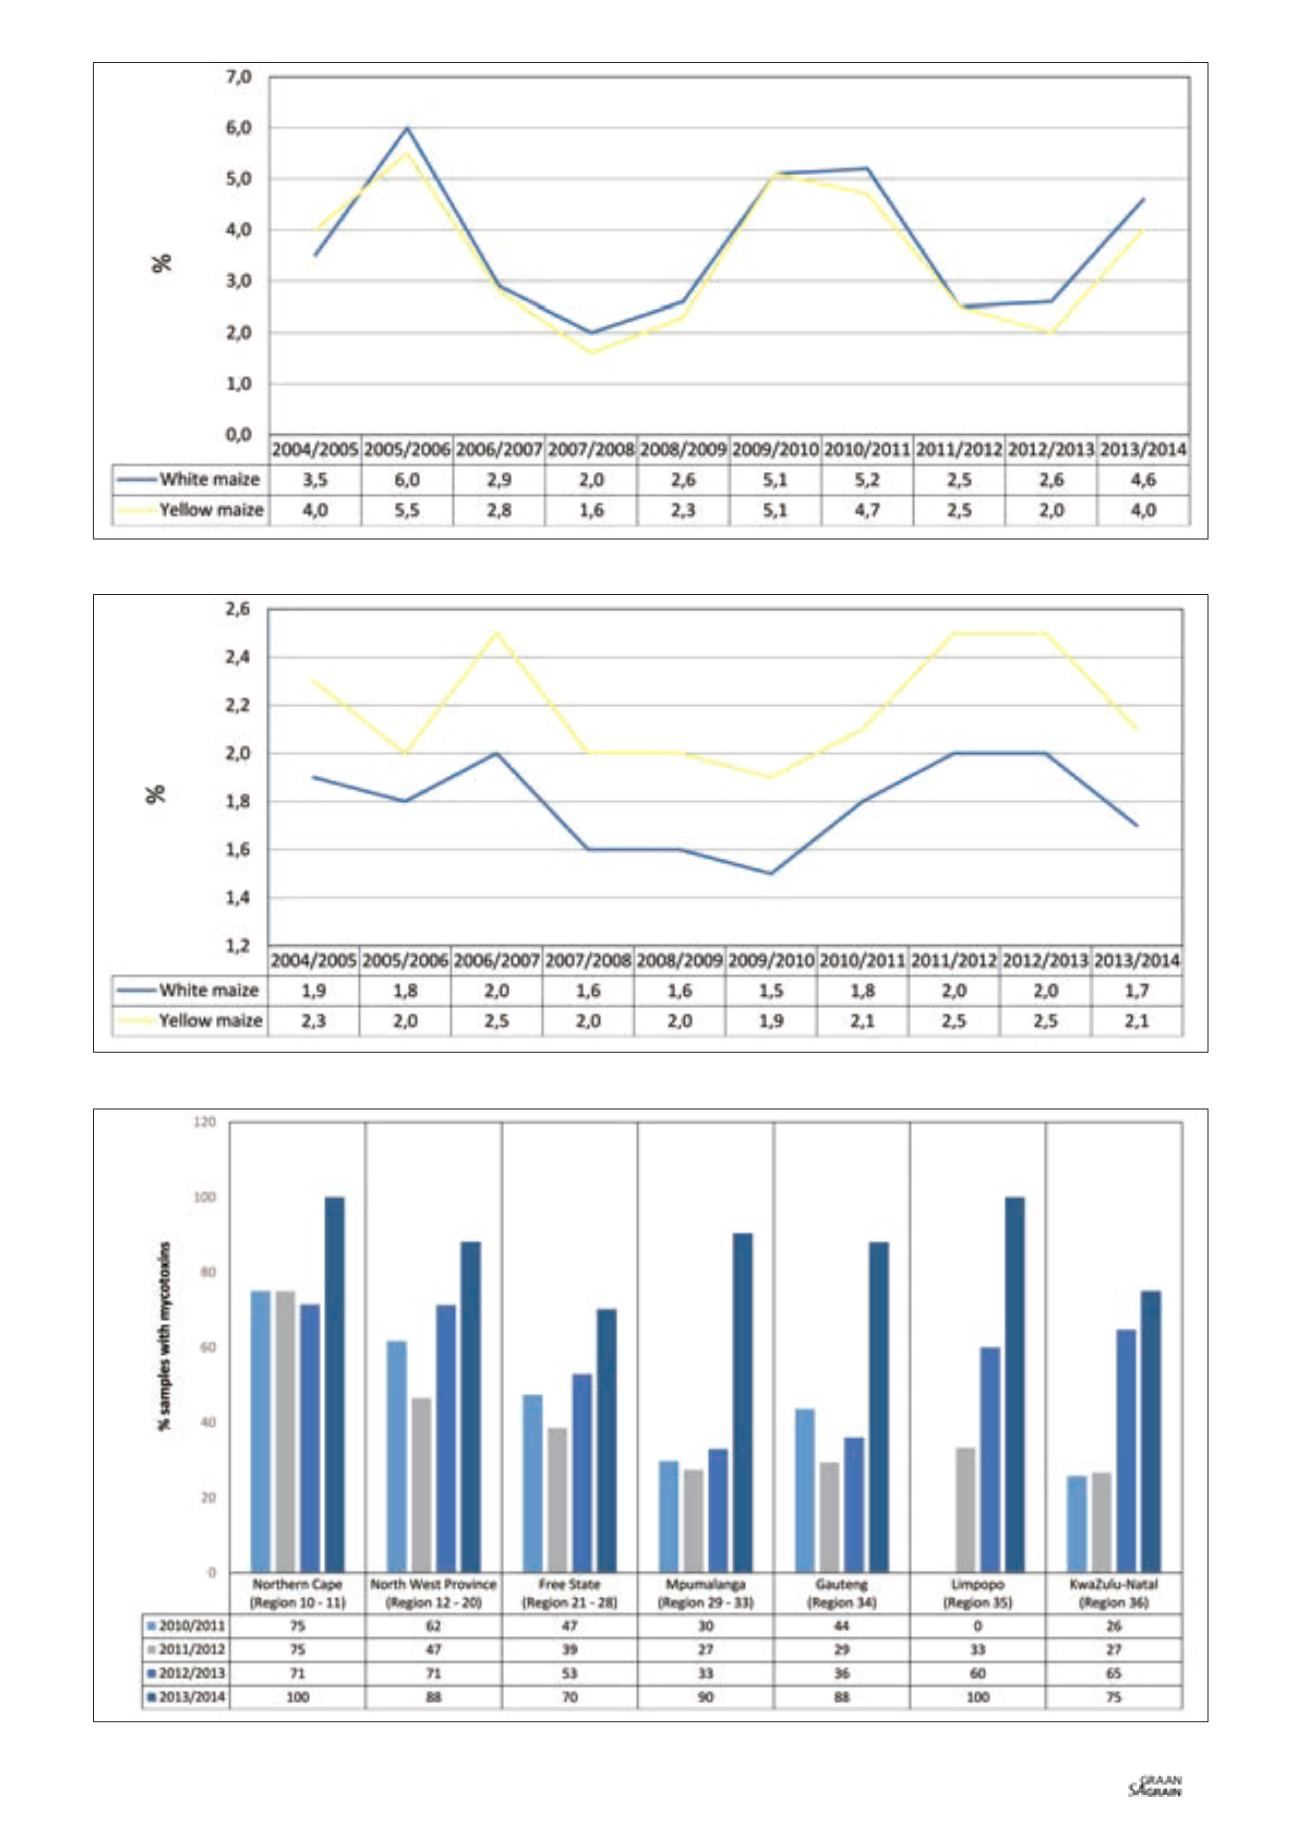
Graph 1: Percentage defective kernels above the 6,35 mm sieve over ten seasons.
Graph 2: Percentage defective kernels below the 6,35 mm sieve over ten seasons.
Graph 3: Percentages of samples that tested positive for mycotoxins per province over four seasons.