


 25 / 48

23
January 2019
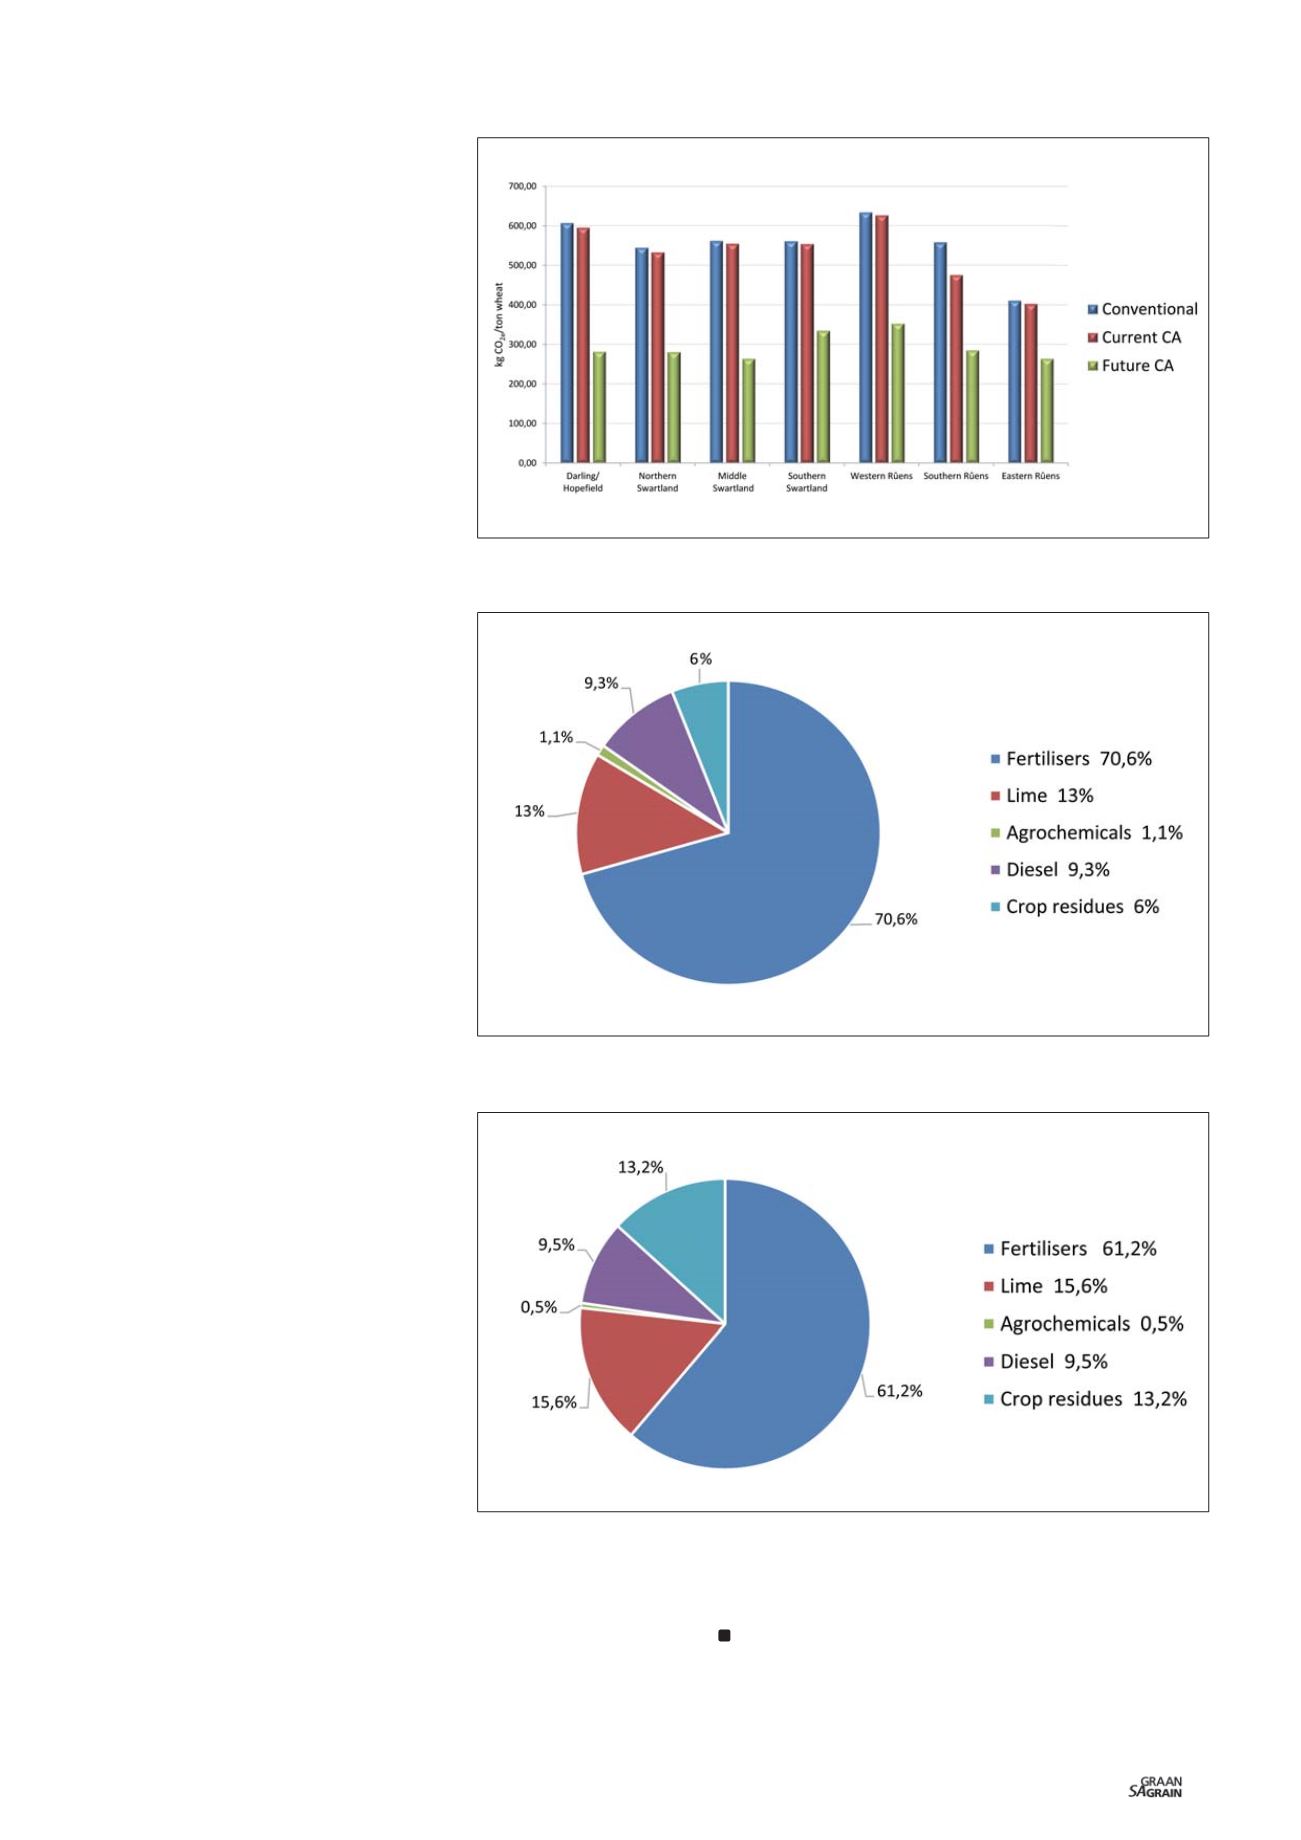
Graph 1: Carbon emissions per ton wheat per farming system per sub-region.
Graph 2: Carbon emission contributions per input per hectare for current scenario.
Graph 3: Carbon emission contributions per input per hectare for future scenario.
Carbon emissions profile
per farming system
The carbon emissions per ton wheat
are presented in
Graph 1
. Wheat is the
only grain grown under all three systems
(
Table 2
on page 21) and therefore this
comparison could be performed.
The results indicated that there was a 46%
decline in carbon emissions per ton grain
with the transition from conventional to fu-
ture CA and a 44% decline from current CA
to future CA. There is only a small difference
in carbon emissions between conventional
and current CA (3,5%) due to very similar
input amounts and yields.
Carbon emissions profile
for current scenario
Weighted average carbon emissions based
on the total yields (tonnes) under conven-
tional and current CA per sub-region are
presented in
Table 3
on page 21.
The overall carbon emissions under the cur-
rent scenario is 513,70 kg CO
2
e/ton grain.
The carbon emission hotspot profile per
hectare for the current scenario is present-
ed in
Graph 2
. It is evident that the farming
input with the largest contribution to over-
all carbon emissions is fertiliser use, but
more specifically synthetic nitrogen, which
makes up 90% of the total fertiliser carbon
emissions at 757 kg CO
2
e/ha out of a total
of 1 182 kg CO
2
e/ha.
Using the total predicted tonnages for
grains under the current CA and future CA
systems, the future weighted average snap-
shot carbon emissions per ton grain for the
winter grain region is predicted to be 328 kg
CO
2
e/ton grain. The results per sub-region
are presented in
Table 4
on page 21.
The carbon emission hotspot profile per
hectare for the future scenario is shown in
Graph 3
. Fertiliser use is the largest con-
tributor or hotspot to total carbon emis-
sions per hectare followed by lime and crop
residues. This profile is the same as for the
current scenario but total greenhouse gas
emission per hectare are significantly lower
at 811 kg CO
2
e/ha.
Conclusion
It is evident that there will be a significant
decrease in carbon emissions in the win-
ter grains industry with the transition to
the future CA systems as well as other en-
vironmental, economic and social benefits
including the protection of biodiversity, in-
crease in net yields and farm income and
improving human nutrition (Putter, Smith
and Lange, 2014).
From the perspective of the climate change
impact, the transition to a higher level and
quality of CA (defined here as future CA) is
highly beneficial for the winter grain region
in the Western Cape. The synergies be-
tween the future CA farming system and the
environmental, economic and social ben-
efits will ensure the sustainability of future
grain cultivation in the region.
References
Earth System Research Laboratory. n.d.
Trends in
atmospheric carbon dioxide
. Retrieved from:
https://
www.esrl.noaa.gov/gmd/ccgg/trends/global.html
.
IPCC. 2007.
IPCC Annex I: AR4 Appendix
. Retrieved
from:
http://unfccc.int
. [2018, August 23].
Putter, T, Smith, H and Lange, D. 2014.
Transforming
the benefits of conservation agriculture into a pro-
CA Manifesto
. Retrieved from:
http://www.grainsa.
co.za/transforming-the-benefits-of-conservation-
agriculture-into-a-pro-ca-manifesto
2 [2017, August
10]
.