


 23 / 48

21
January 2019
INPUTS
ASSUMPTIONS
Yield
Increase with 10%
Fuel
Decrease with 50%
Fertiliser
Decrease with 50%
Lime
No change
Fungicides
Decrease with 50%
Herbicides
Decrease with 50%
Insecticides
Decrease with 60%
Burning of crop residues
No burning
% of the above ground residue removed 30% removed
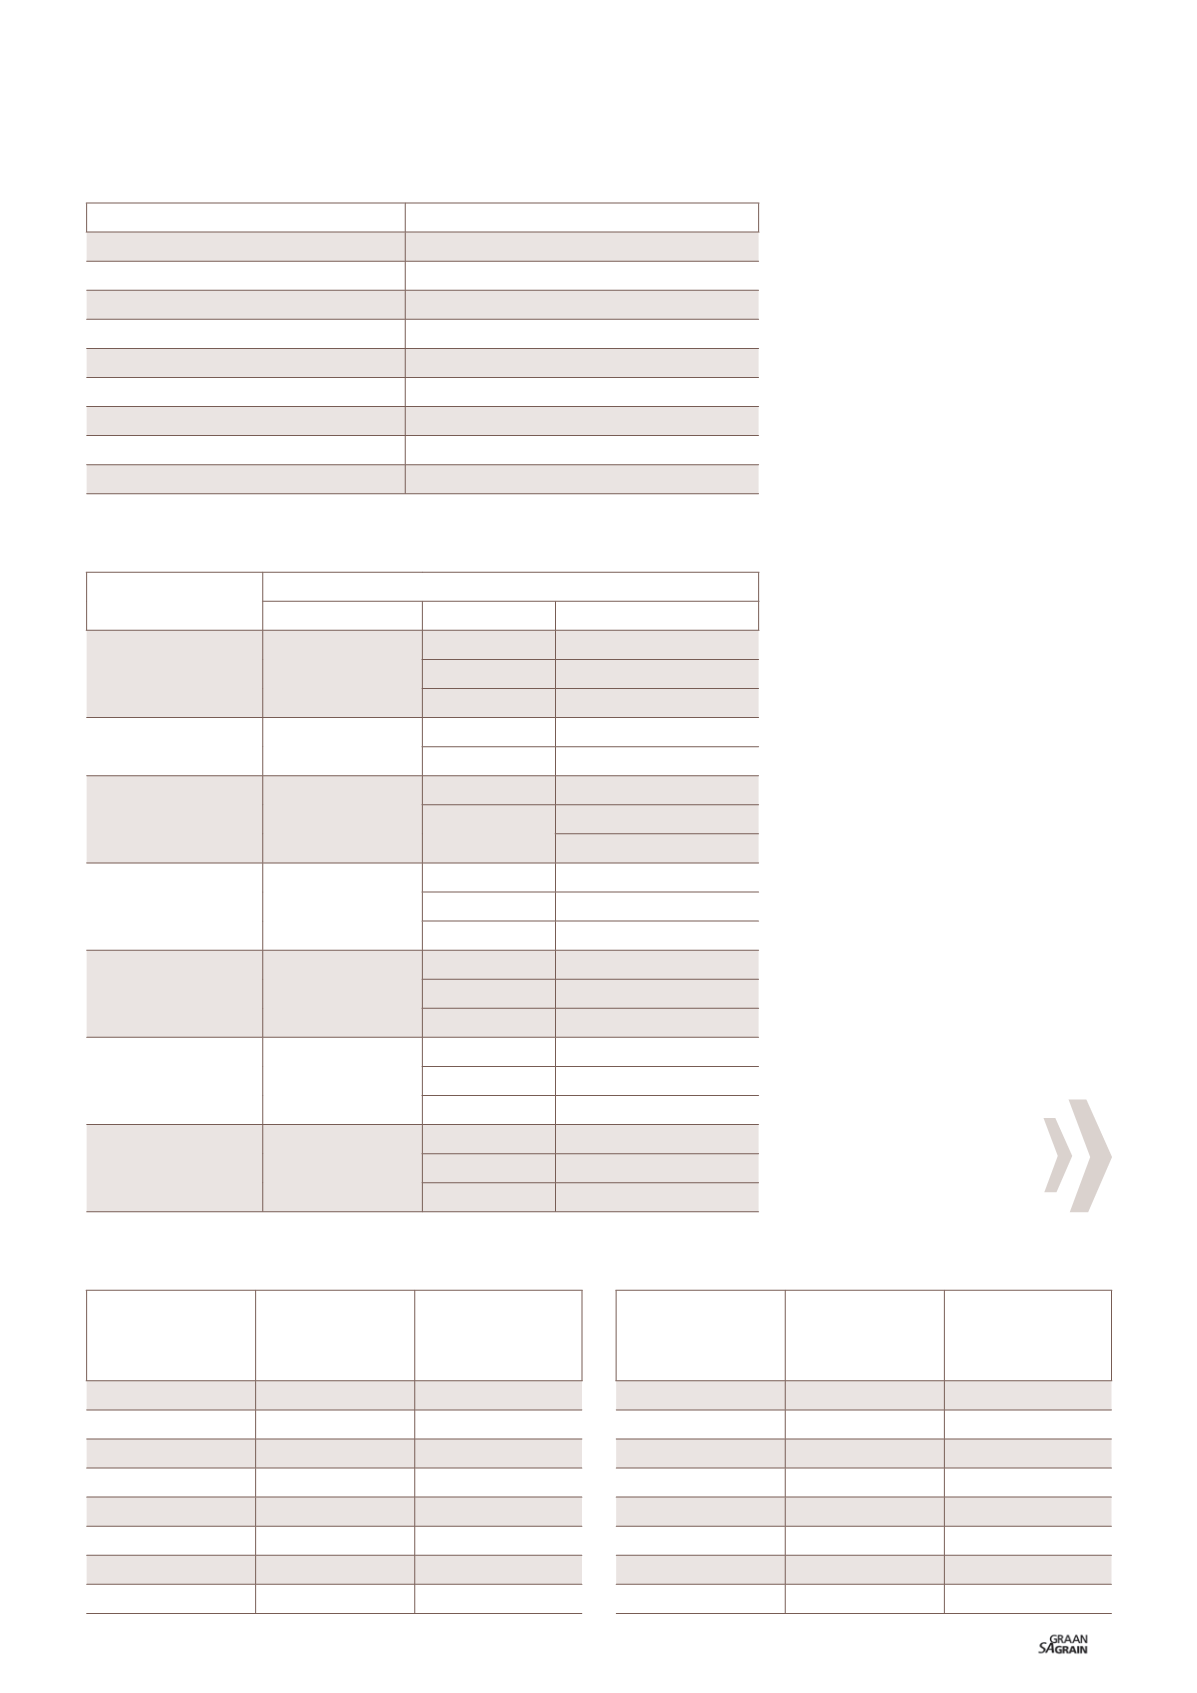
TABLE 1: ASSUMPTIONS FOR INPUTS FOR FUTURE CA SYSTEMS.
REGION
FARMING SYSTEM
CONVENTIONAL
CA
FUTURE CA
Darling/Hopefield
Wheat
Wheat
Wheat
Medics
Medics
Lupins
Canola
Northern Swartland Wheat
Wheat
Wheat
Medics
Medics
Middle Swartland
Wheat
Wheat
Wheat
Medics
Barley
Canola
Southern Swartland Wheat
Wheat
Wheat
Medics
Medics
Canola
Canola
Western Rûens
Wheat
Wheat
Wheat
Barley
Barley
Canola
Canola
Southern Rûens
Wheat
Wheat
Wheat
Barley
Barley
Canola
Canola
Eastern Rûens
Wheat
Wheat
Wheat
Barley
Barley
Canola
Canola
TABLE 2: WINTER GRAIN SUB-REGIONS WITH CORRESPONDING
CROP ROTATIONS AND FARMING SYSTEMS.
REGION
TOTAL TONNAGE
CARBON EMIS-
SIONS FOR REGION
(KG CO
2
e/TON
GRAIN)
Darling/Hopefield
54 507
597,23
Northern Swartland
146 217
534,76
Middle Swartland
276 399
555,90
Southern Swartland
21 896
609,73
Western Rûens
182 449
637,92
Southern Rûens
209 245
485,85
Eastern Rûens
325 585
396,22
Weighted average
513,70
REGION
TOTAL TONNAGE
CARBON EMIS-
SIONS FOR REGION
(KG CO
2
e/TON
GRAIN)
Darling/Hopefield
58 993
339,93
Northern Swartland
157 914
327,68
Middle Swartland
307 043
314,72
Southern Swartland
22 283
400,70
Western Rûens
182 575
418,47
Southern Rûens
207 598
334,52
Eastern Rûens
315 426
276 38
Weighted average
327,83
TABLE 3: CARBON EMISSIONS PER TON GRAIN FOR CURRENT
SCENARIO PER SUB-REGION AND OVERALL.
TABLE 4: CARBON EMISSIONS FOR FUTURE SCENARIO
PER SUB-REGION.
Phase 1 was the start of a longer term
process of using the carbon footprint
methodology and results within the grain
industry as an adaptive management tool
(
Figure 1
).
Project scope and
methodology
The study only included activities and in-
puts at the farm stage of the grain value
chain. The methodology used to calculate
the carbon emissions per ton grain was the
PAS 2050: 2011 protocol developed by the
British Standards Institute (BSI). Carbon
emissions is only one of a range of impacts
that needs to be taken into account to obtain
a holistic view of the environmental impacts
of a farming system.
Winter grain sub-regions included in this
study are presented in
Figure 2
. Existing
data (inputs and yields) was collected from
representative production practices in each
region to model the current scenario of car-
bon emissions.
The current scenario consists of a combi-
nation of conventional and conservation
agriculture farming systems (current CA)
currently practiced in these regions. For
the future scenario, an ideal but realistic CA
system (future CA) predicted to be adopted
by most grain producers 20 years into the
future was calculated with corresponding
inputs and yields.
In the Western Cape there is currently no
big difference between conventional farm-
ing and CA. The conventional wheat farm-
ing system does not practise crop rotation
and therefore wheat is planted every year.
In the current CA and future CA systems
crop rotation is practised and the commodi-
ties included in the models per region were
wheat, barley, canola, medics and lupins.
All inputs were specified on a per hectare
basis. The carbon emissions (kg CO
2
e/ton)
per farming system were calculated from
the data provided.