


 3 / 73

ႅ
CHAPTER 1
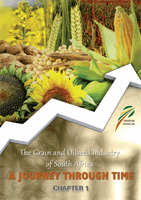
Shipping of maize around 1908.
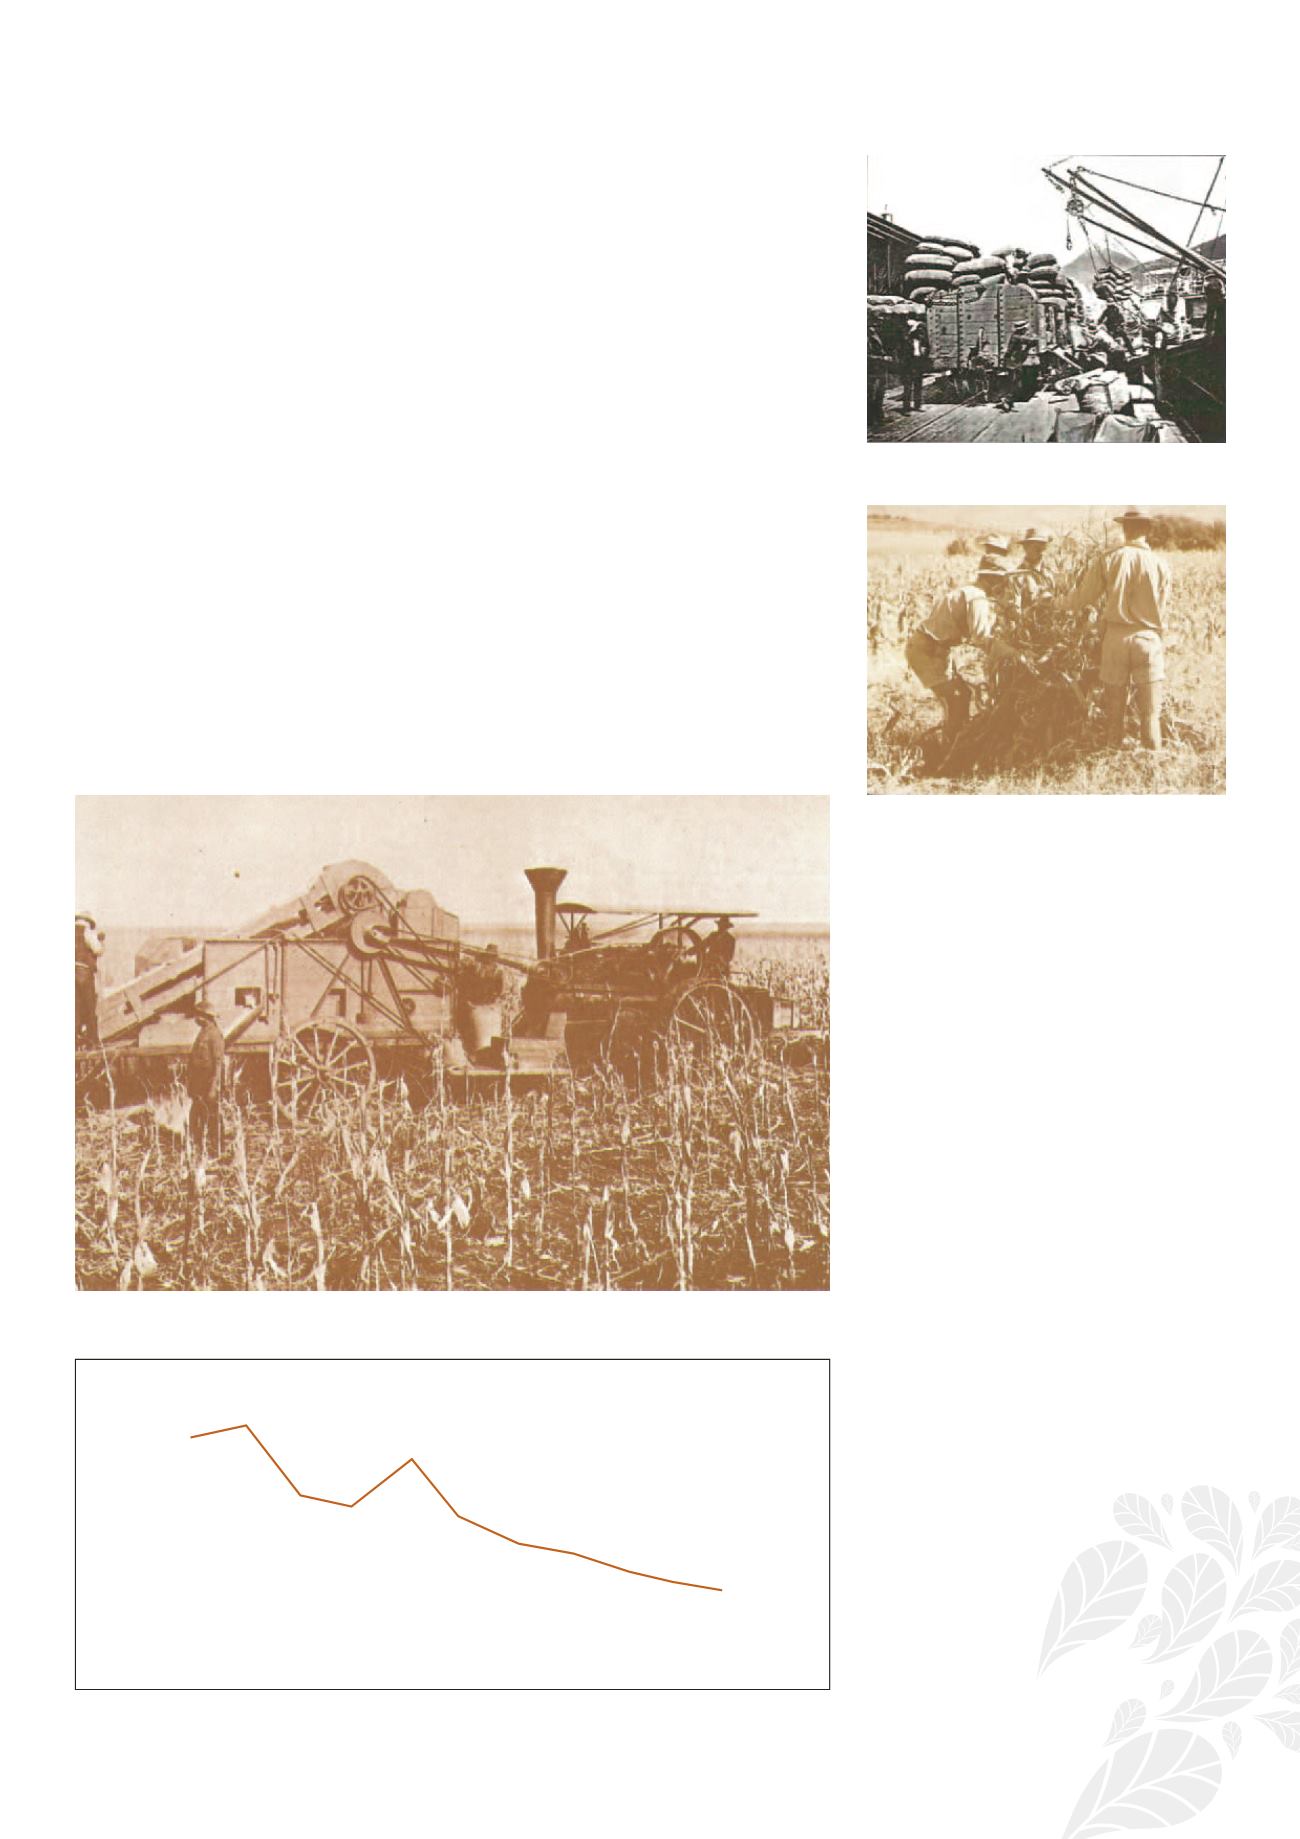
Maize was stacked into little piles before it
was threshed.
Maize being threshed.
Both the introduction and the abolishment of control were preceded by clear
changing trends and had a material effect on the broader agricultural industry, but
also on the grain and oilseeds industries in particular. Control over the production
and marketing of agricultural products was not unique to South Africa and it is
even probable that its introduction was in fact influenced by international trends.
In the run-up to the eventual deregulation of agriculture in South Africa the system
of controlled marketing was often criticised, and the allegation was made that
it had not achieved its aim. Regardless of these opinions there can be no doubt
that the controlled environment created opportunities for the South African grain
and oilseeds industries to develop into a commodity sector and to grow, thereby
enabling it to make a material contribution to development in South Africa. Not
only did it make a significant contribution to the country’s gross domestic product,
but it was also an important and material area of job creation, particularly for
unskilled labourers.
This chapter places the history of the production of maize, winter cereals (wheat,
oats and barley), oilseeds (groundnuts, sunflower seed, soybeans and canola) and
sorghum in South Africa in perspective, with reference to a few outstanding events
that influenced it over time. The mere scope of the information on this topic makes it
impossible to expose even the tip of the iceberg. Consequently this publication refers
only to a few major events, highs and lows, key role-players and light moments in
the industry that were recorded in sources or are remembered by the role-players
at the time.
25
20
15
10
5
0
Percentage
1910
1920
1930
1940
1950
1960
1970
1980
1990
2000
2010
Graph 1: Agriculture’s contribution to the GDP
21 22,2
14,2
12,7
17,7
12,4
7,1
6,1
4,6
3,3 2,5