


 105 / 116

103
October 2017
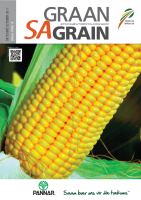
Graph 1: Percentage defective kernels above the 6,35 mm sieve over ten seasons.
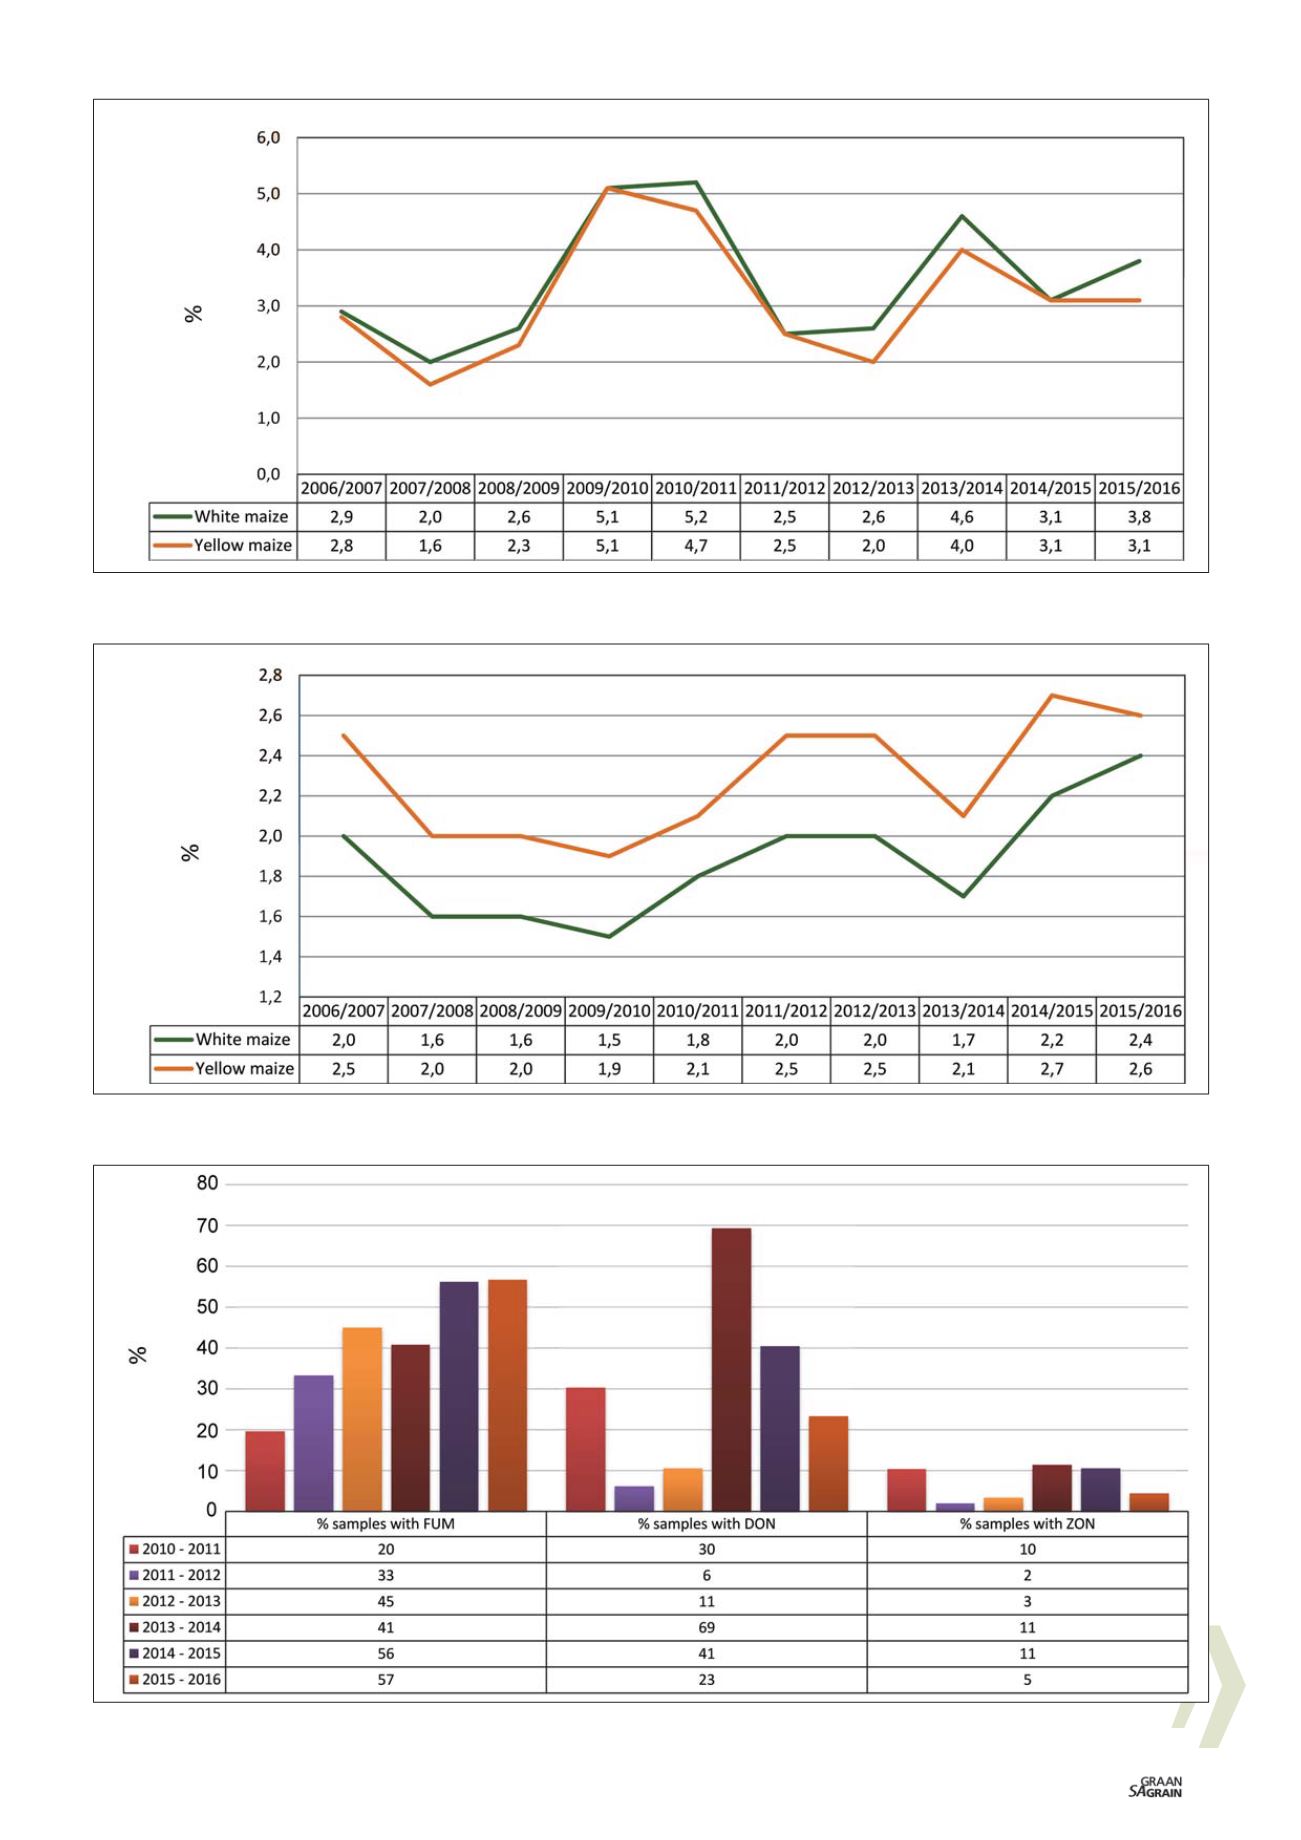
Graph 2: Percentage defective kernels below the 6,35 mm sieve over ten seasons.
Graph 3: Percentage white and yellow maize samples (from the 350 samples selected) that tested positive
for mycotoxins over six seasons.