


 106 / 116

Maart 2017
104
RELEVANT
Quality of wheat
TYPE OF
ANALYSIS
SOUTH AFRICAN
AVERAGE
RANGE OF
SOUTH AFRICAN
VALUES
GENERAL FLOUR CATEGORIES
WEAK
FLOUR
MEDIUM FLOUR STRONG FLOUR
VERY STRONG
FLOUR
Farinograph
Water absorption,
% (14% mb)
60,8
55,7 - 66,2
<57
57 - 60
61 - 65
>65
Development
time, minutes
5,8
2,5 - 11,8
<2,5
2,5 - 4
43 012,0
>10
Stability, minutes
8,0
4 - 16,5
2 - 4
4 - 7
10 - 15
>15
Mixing tolerance
index, BU
38,0
12 - 66
>100
60 - 100
15 - 50
<10
Extensigraph
Area, cm
2
105,0
54 - 211
<80
80 - 120
120 - 200
>200
Maximum height,
BU
373,0
227 - 541
200 - 250
300 - 450
500 - 650
>650
Alveograph
Deformation
energy, 10
-4
J
250,0
147 - 409
<130
130 - 200
200 - 300
>300
Strength, cm
2
38,3
22,5 - 62,5
<20
20 - 30
30 - 45
>45
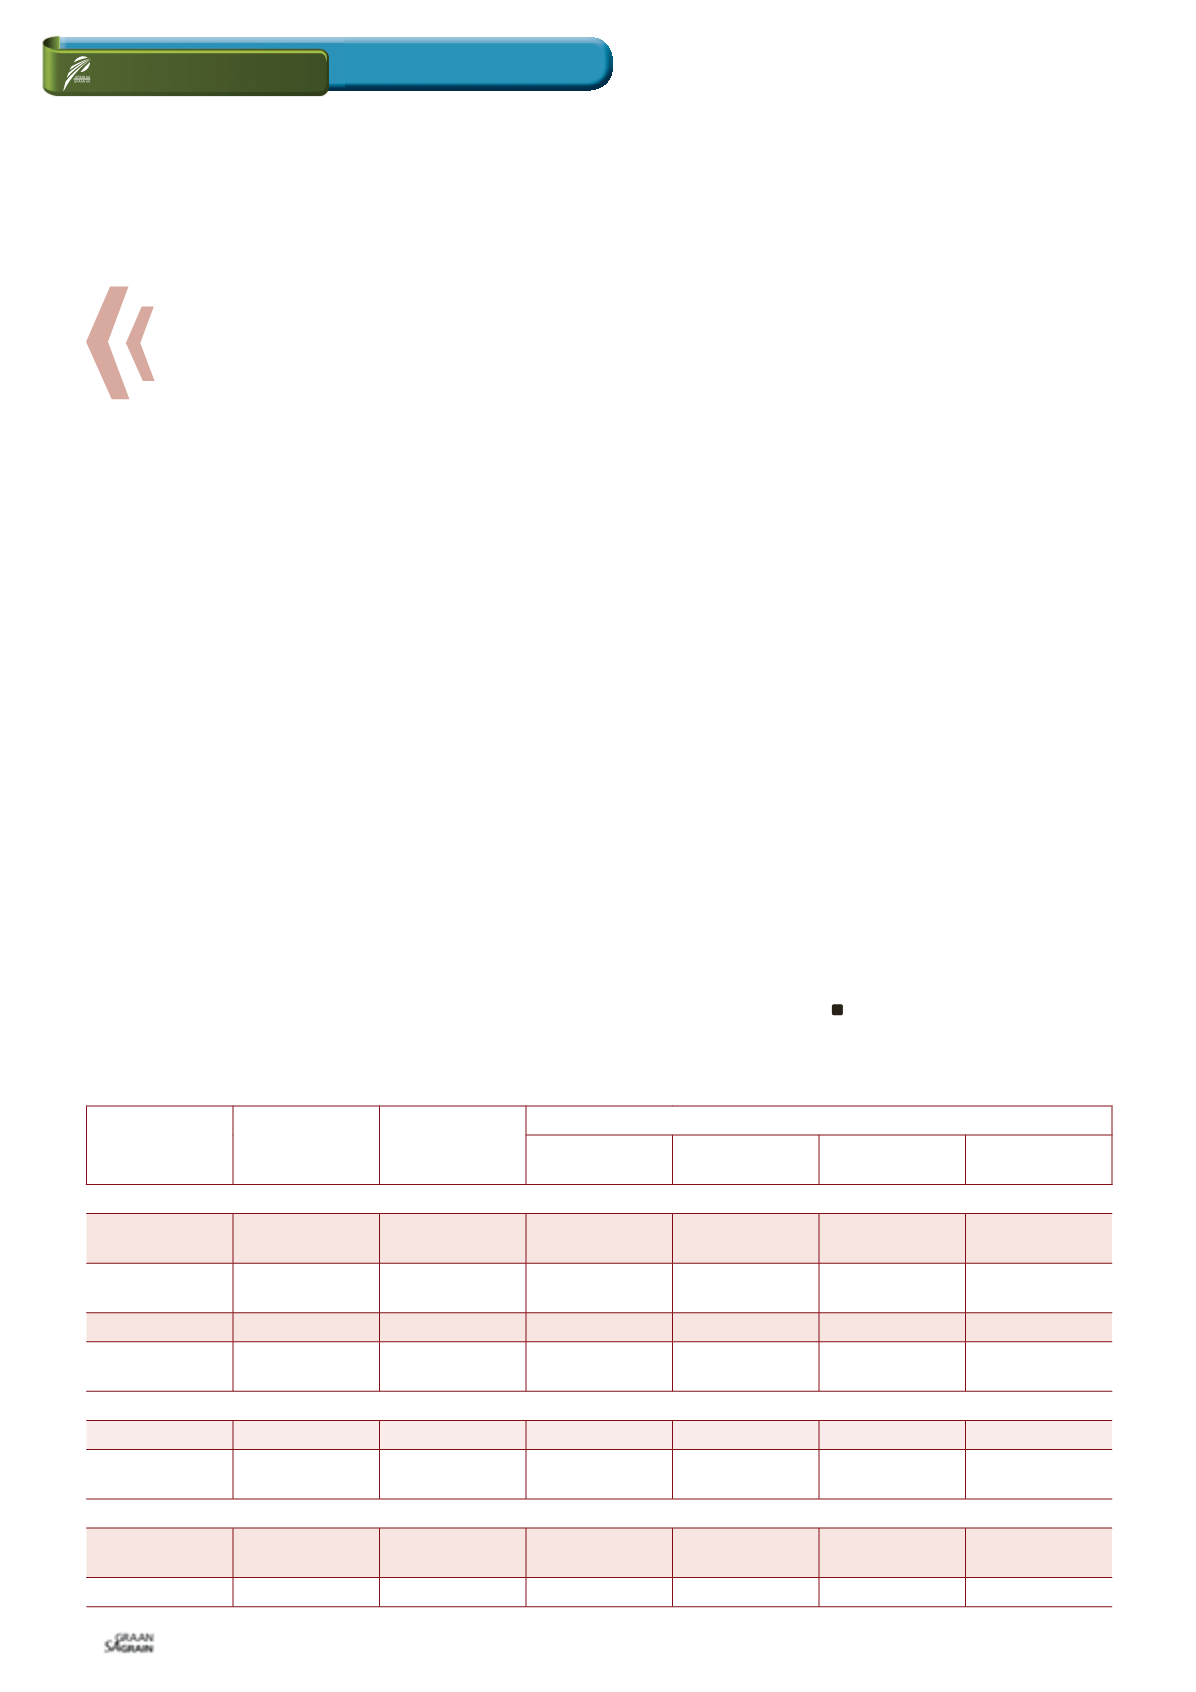
TABLE 1: LOCAL DOUGH QUALITY OF THE 2015/2016 SEASON IN COMPARISON WITH GENERALLY ACCEPTED INTERNATIONAL
FLOUR CATEGORIES.
The weighted average Bühler MLU 202 laboratory mill extraction for
the 70 composite samples was 73,4%, equal to the previous season.
The average Kent Jones colour this season was -3,5 KJ units, slight-
ly lower (in other words lighter/brighter) than the previous season.
The CIE L*a*b* values, determined by means of the Konica Minolta
CM-5 spectrophotometer, compared to the range of average values
obtained from the 2012/2012 to 2014/2015 seasons (indicated
in brackets), showed good correlation – L* 93,78 (93,77 - 93,99),
a* 0,47 (0,40 - 0,44) and b* 9,75 (9,50 - 9,392) L* represents light-
ness (100 being white and 0 being black), a* represents green to red
variation and b* represents variation from blue to yellow.
The average ash content was determined to be 0,65% on a dry
basis (moisture free basis), compared to the 0,59% of the previous
season. According to the wheat product regulations (Government
Notice No. R. 186 of 22 February 2008), cake flour’s ash content
should not exceed 0,60% and white bread flour’s should be be-
tween 0,6% to 1%.
The wet gluten (14% mb) averaged 31,9% and the dry gluten also
on a 14% moisture basis, 11%. These values are higher than the
28,9% and 9,8% respectively of the previous season, as can be ex-
pected taking the higher protein contents into account. The average
gluten index value was 95, ranging between 84 and 99.
The gluten index provides an indication of the gluten strength
(higher being better) and is not influenced by the protein content.
A value between 70 and 100 is generally accepted as good quality
for pan bread baking purposes. The average gluten index value last
season was 88.
The weighted mixogram peak time of the flour from the Bühler mill
was 2,6 minutes, comparing well with the 2,7 minutes last season.
Mixing time, in general, decreases as protein content increases to
about 12%, thereafter remaining approximately constant with flour
protein increases.
In general, a medium to strong flour quality is required for the type
of baking processes used in South Africa for pan baked loaves,
see
Table 1
.
The 100 g loaves baked using the straight-dough optimised bread
making method, received an evaluation rated as ‘Excellent’. The
basis for this evaluation refers to the relationship between the pro-
tein content and the bread volume.
40 samples, randomly selected to represent different regions as
well as classes and grades, were tested by means of a SANAS
ISO/IEC 17025 accredited multi-mycotoxin screening method us-
ing UPLC-MS/MS. With this technique simultaneous quantification
and confirmation of Aflatoxin G1; B1; G2; B2, Fumonisin B1; B2;
B3, Deoxynivalenol, 15-ADON, HT-2 Toxin, T-2 Toxin, Zearalenone
and Ochratoxin A are possible in one run.
Four samples tested positive for Deoxynivalenol (DON) residues.
The average value of the four positive results were 397 μg/kg (ppb)
and the highest value measured 593 μg/kg, which is still well be-
low local and international maximum residue levels. Last season,
five samples tested positive for DON residues with an average value
of 229 μg/kg (ppb) and the highest value obtained 361 μg/kg.
The 2015/2016 local and imported wheat quality results are availa-
ble on the SAGL website, the latest wheat crop quality report can
also be downloaded in PDF format.
Our sincere appreciation to the Winter Cereal Trust for financial
support of this annual survey, to Agbiz Grain members and milling
companies for providing the crop samples as well as DAFF inspec-
tors at the harbours for providing representative samples of each
shipment of imported wheat.