


 105 / 116

103
March 2017
Graph 2: Average protein content (12% mb) over ten seasons.
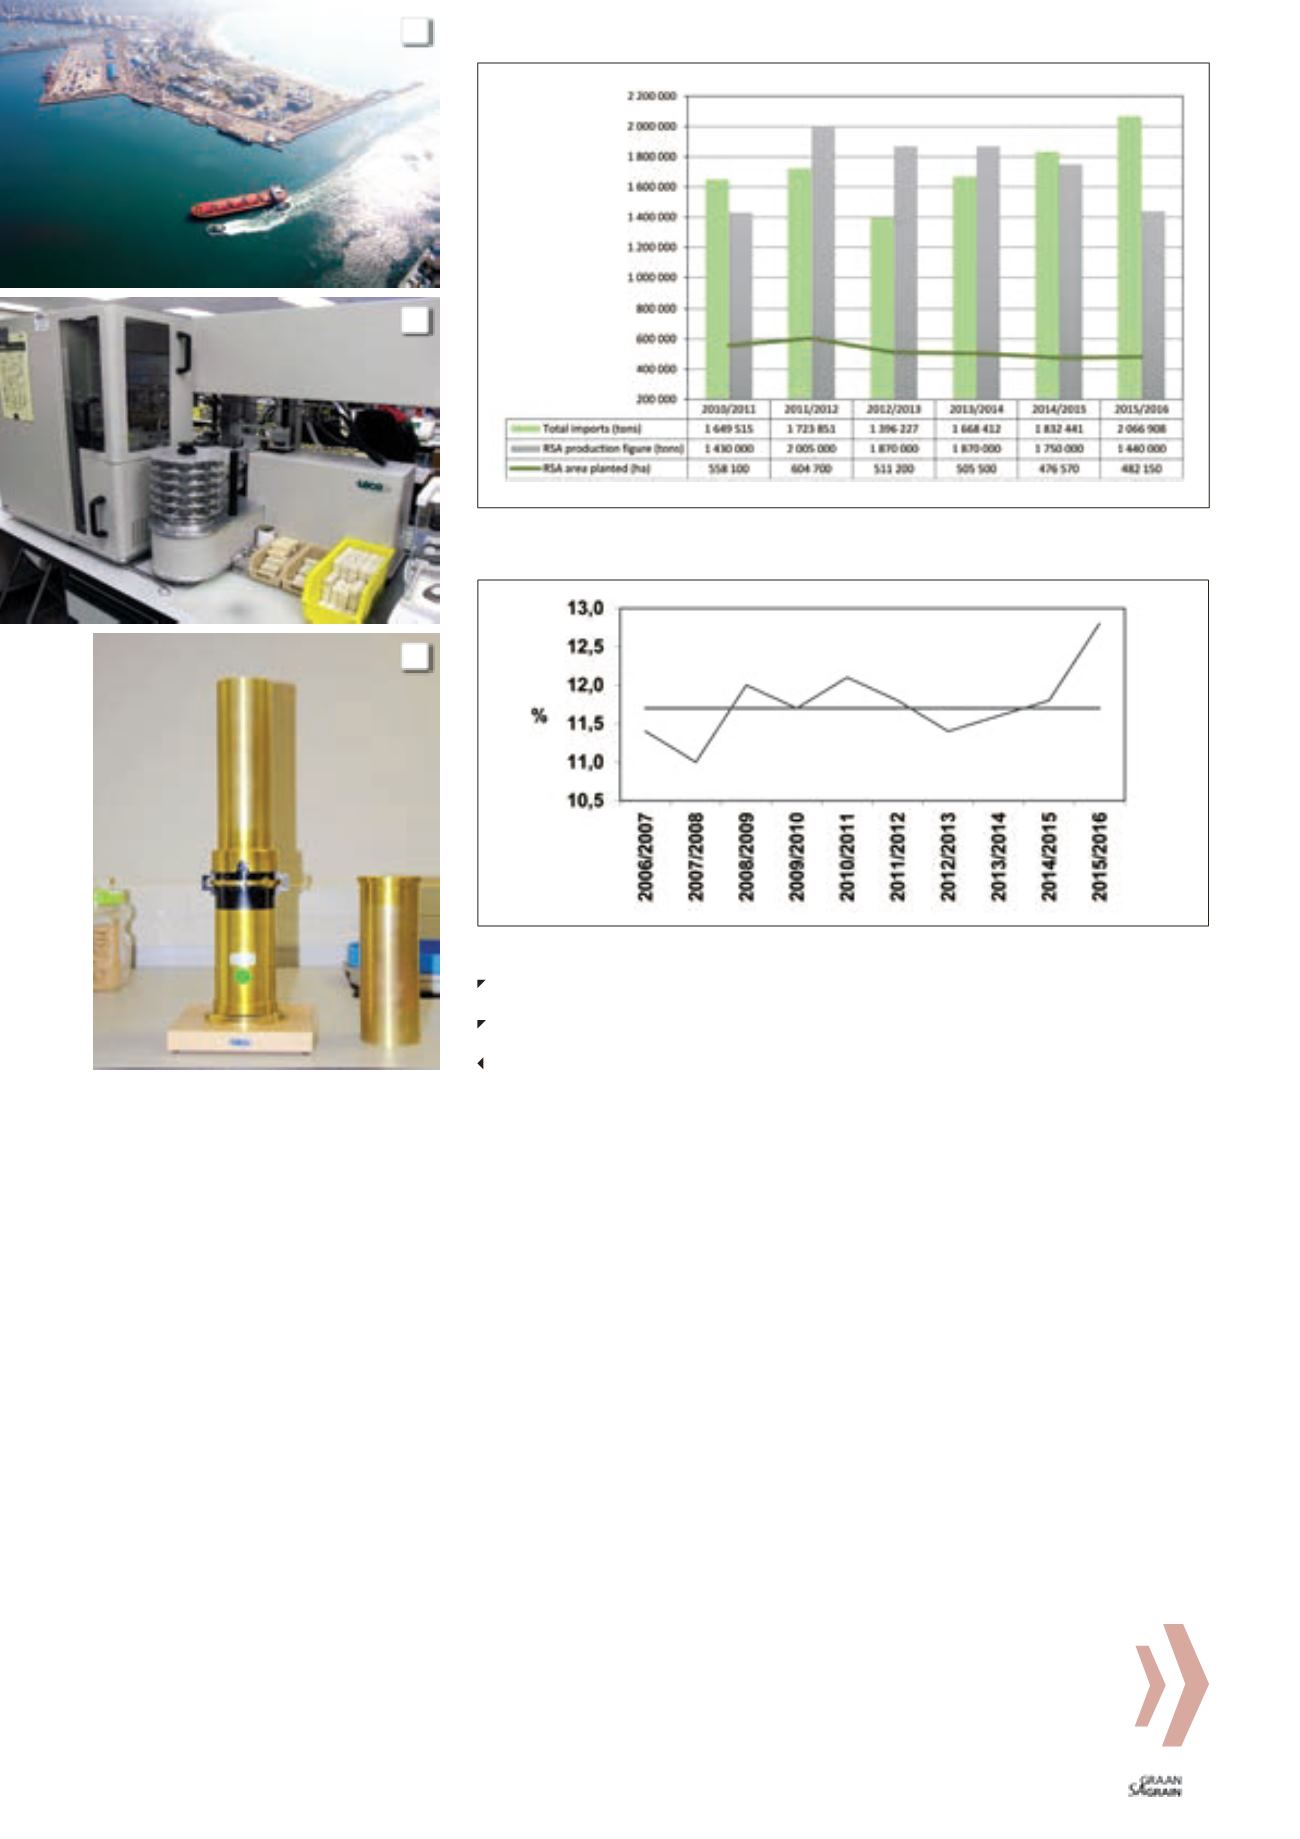
Graph 1: Total imports figure versus South African production and area planted
over the past six seasons.
1: Approximately 82% of the imported wheat was received at Durban
harbour.
2: The Leco Trumac N protein analyser used for the determination of
protein content.
3: The Kern 222 instrument for determination of the hectolitre mass.
1
2
3
Hectolitre mass or test weight, the mass of a standard volume of
grain, is generally believed to be a measure of the grain’s bulk den-
sity and an indication of the potential flour yield of wheat.
The latter is not always true since hectolitre mass is also correlat-
ed with factors such as the density and packing characteristics of
the wheat kernel. Hectolitre mass is influenced by amongst others,
cultivar (skin appearance – smooth or wrinkly), moisture content
and the presence of other grain, unthreshed ears, foreign matter,
broken grain and screenings.
The average hectolitre mass increased by 0,9 kg/hl to 81,1 kg/hl
compared to the previous season and was also higher than the six
year weighted average of 80,5 kg/hl for determinations done by
means of the Kern 222 instrument.
Of the 21 samples that reported values below the 77 kg/hl mini-
mum level for grade B1 wheat, twelve originated in the Western
Cape (winter rainfall area), five in the North West Province, three
in the Free State and only one in Limpopo. The regional averages
ranged from 79,7 kg/hl in the winter rainfall areas to 82,6 kg/hl in
the irrigation areas.
The thousand kernel mass, reported on a 13% moisture basis, de-
creased further from 39,3 g in the 2013/2014 season to 38,8 g in the
past season to 36,8 g this season. Averages over production areas
varied from 34,8 g in the Free State to 37,9 g in the irrigation ar-
eas. The weighted average percentage screenings (1,8 mm sieve)
of 1,71% was higher than the 1,55% and 1,58% of the previous
two seasons. The winter rainfall areas reported the highest aver-
age percentage, namely 1,86% and the irrigation areas the lowest
of 1,43%.
The weighted average falling number was 393 seconds, the high-
est average value of the past 18 seasons. As a result, none of the
samples analysed for this survey reported falling number values
below 250 seconds. The highest average falling number value of
405 seconds, was reported for the irrigation areas.
All falling number values reported are corrected for the altitude
at which the test is performed. During the previous two seasons
four and 29 samples respectively reported falling numbers below
250 seconds.
The weighted mixogram peak time on flour from the Quadromat
mill averaged 2,7 minutes, shorter than the 3 minutes of the previous
two seasons as well as the ten year average (2,9 minutes).
Extraction rate is an indication of the flour yield that can be obtain-
ed from a given amount of wheat. The extraction rate achievable on
industrial scale mills is a number of percentage points higher than
on laboratory scale mills due to an increase in roller surface area.
Composite samples per class and grade per production region
are cleaned, tempered/conditioned and then milled to facilitate
flour and dough quality assessment.