


 39 / 84

37
June 2015
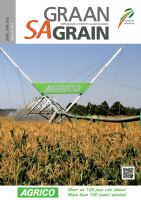
various provinces. From (2005 - 2010), the
ARC average yield was 2,1 t/ha and coun-
try average was 1,2 t/ha. Naturally, yield
trial data will always produce higher yields
on small plots compared to actual full scale
production. It does, however, illustrate the
yield gap that exists between the genetic
potential of the plant and the actual yields
that are obtained in the field. What is more
interesting to note is that these gaps seem
to be proportionally larger than what is the
case for maize and soybeans.
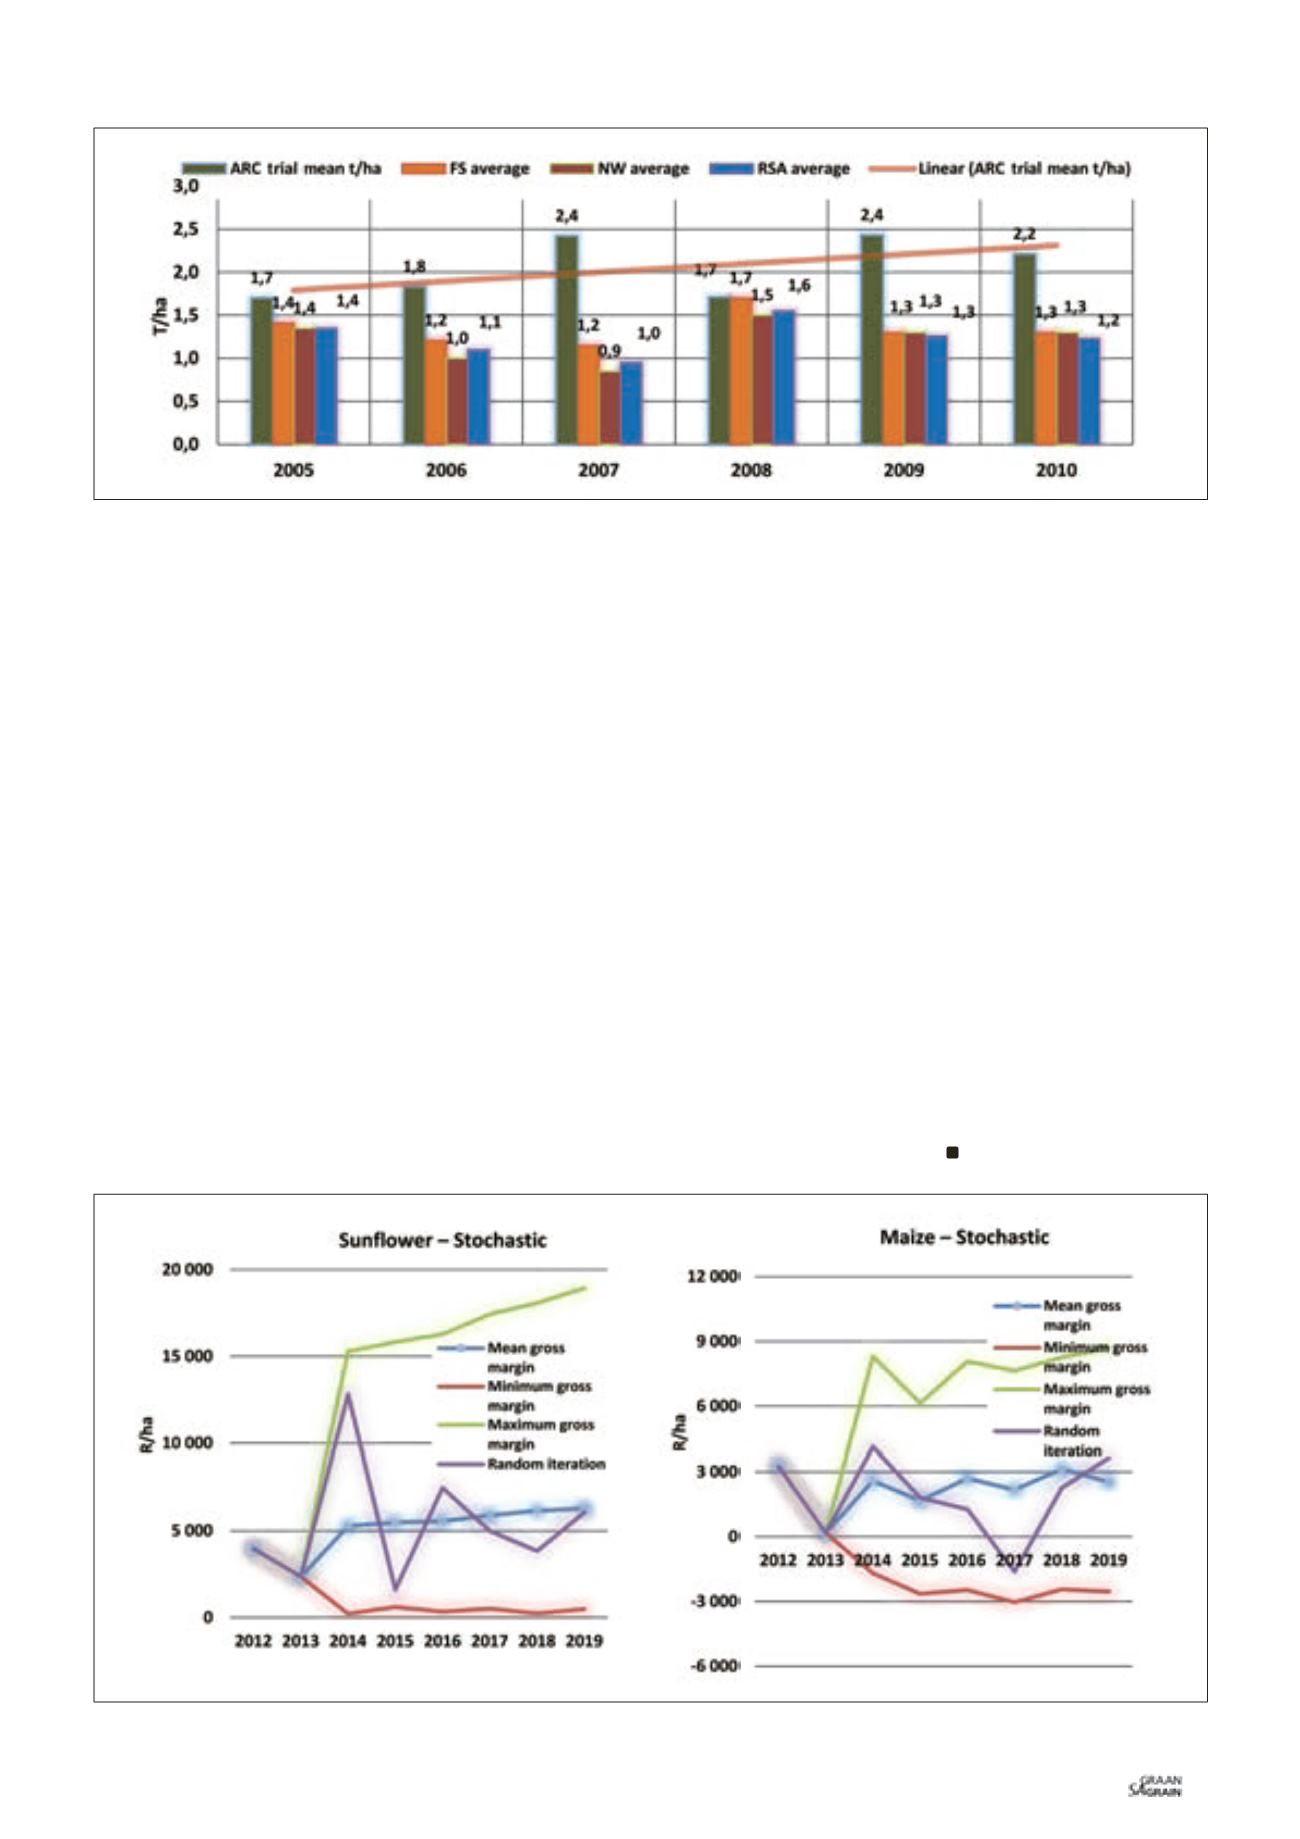
Drawing any final conclusions merely on
yields is an over-simplification of a com-
plex production system. Therefore, BFAP
applied a financial simulation model
(FINSIM) to generate a stochastic outlook for
the gross margins of a prototype maize and
sunflower farm in the North West Province
(
Graph 3
).
The stochastic outlook was generated by
imposing the actual historic variations in
yields, costs and prices of a specific farm
on to the outlook that was generated by the
BFAP sector level model. It has to be men-
tioned that this 1 200 ha crop farm in the
North West Province cannot be regarded as
a typical farm as actual yields that were re-
corded over the survey period (2010 - 2013)
exceeded the average yields of the region.
This, however, stresses the point that if
sunflowers are treated as a cash crop in its
own right, it becomes a profitable enter-
prise to consider. The results indicate that
the sunflowers proved to have a higher
average gross margin than maize over the
long run and more importantly, the poten-
tial minimum gross margin for sunflower
remained positive throughout the outlook
period, whereas the potential minimum
gross margin for maize turned out to be sig-
nificantly negative.
At the end of the day it all comes down to
the competitiveness of the industry. It is im-
portant to take a holistic approach since it is
not only the competitiveness of sunflowers
relative to other cash crops at farm level that
counts, but also the competitiveness of the
complete value chain relative to the major
exporting countries.
The sunflower seed price is derived from
the cake and oil prices and since these
commodities are imported, the domestic
industry is facing stiff competition from im-
ported seed, oil and cake that can be traced
right back to farm level. For example, being
a major exporter and therefore trading at
export parity levels, the average farm gate
price in Argentina (converted to rand) for
the period 2010 - 2012 equalled R2 153/ton
compared to the South African producers
who received an average farm gate price of
R3 747/ton that was derived from the im-
port parity levels of oil and cake. Finally, it
is important to note that a number of issues
related to the competiveness of sunflower
seed production were not discussed in this
article. For example, the potential premium
on sunflower seed with high oil content or
the development of niche markets like the
high-oleic market that has been expanding
in Europe.
Graph 2: Average yield comparison – ARC trial study and national averages (2005/2006 - 2010/2011).
Source: Nel, A.A. in ARC-GCI (2012) compiled by BFAP (2013)
Graph 3: Stochastic evaluation of gross margins on sunflower versus maize production in the North West Province.
Source: BFAP (2013)