


 33 / 44

31
December 2015
To measure the enzyme activity (mainly the
α
-amylase activity),
the falling number method is used as an indicator of kernel germina-
tion or sprouting. Both high (>400 sec) and low (<250 sec) falling
numbers will have a negative effect on the baking quality.
The average falling number this season was 368 seconds. Samples
from the Free State’s production regions gave the lowest average
falling number of 352 seconds and those of the Western Cape gave
the highest, namely 379 seconds. Compared to the 29 samples in
the previous season, only four samples reported falling numbers be-
low 250 seconds this season. All falling number values reported are
corrected for the altitude at which the test was performed.
The average mixogram peak time on flour from the Quadromat mill
averaged three minutes, comparing very well with the ten year aver-
age (2,9 minutes) as well as previous seasons. The mixogram peak
time of the flour from the Bühler mill was 2,7 minutes, similar to the
2,8 minutes peak time last season.
Irrigation areas tend to have the longest peak time and the Western
Cape the shortest. The peak time is a measure of optimum dough
development and thus a measure of protein quality. Peak times of
2,8 to 3,5 minutes are generally considered acceptable.
The extraction rate is an indication of the flour yield that can be ob-
tained from a given amount of wheat. Composite samples per class
and grade per production region were cleaned, conditioned and then
milled. The average Bühler MLU 202 laboratory mill extraction for
the 70 composite samples was 73,4% – similar to previous seasons.
Colour is one of the important properties of milled grains and the
colour of wheat flour affects the colour of the finished product.
Generally speaking, a bright white colour flour is more desirable for
most products. The Kent Jones colour (wet colour) method deter-
mines the influence of bran and/or extraneous material present in
flour. The lower the Kent Jones colour, the lighter/brighter the flour
and vice versa. The average Kent Jones colour this season was
-3,3 KJ units, slightly lower than the previous two seasons.
A dry colour determination by means of a Konica Minolta CM-5
spectrophotometer is also performed. The colour coordinates in the
CIE L*a*b* (CIELAB) colour model define where a specific colour lies
in a Cartesian graph. L* represents lightness (100 being white and
0 being black), a* represents a green to red variation and b* repre-
sents a variation from blue to yellow. The results, with the range in
brackets, were as follows: L* 93,77 (92,98 - 94,30), a* 0,44 (0,22 -
0,59) and b* 9,72 (8,21 - 11,11). These values correlate well with the
previous two seasons.
Gluten is the water-insoluble complex protein fraction present in
wheat flours and is composed principally of two functional protein
components. Glutenin, the high molecular weight fraction, contrib-
utes elasticity (is less extensible); and Gliadin, the low molecular
weight fraction, provides the viscous component (is highly extensi-
ble and less elastic).
The ability of wheat flour to produce dough with good gas retaining
properties is therefore attributed to gluten. The wet gluten (14% mb)
this season averaged 28,9% and the dry gluten also on a 14% mois-
ture basis, 9,8%. These values are slightly lower than the previous
season, but are still indicative of a good quality gluten for pan bread
baking if the flour protein content of 10,7% is considered.
Wet gluten content can be correlated to loaf volume and dry gluten
content to the crude protein content. The difference between the
wet and dry gluten content is an indication of the water-holding ca-
pacity of the gluten proteins, which in turn is related to flour water
absorption.
The average gluten index value was 87, ranging between 78 and 97.
The gluten index provides an indication of the gluten strength and is
not influenced by the protein content. A value between 70 and 100
is generally accepted good quality for bread baking purposes. The
average gluten index value last season was 86.
As it is formed from flour and water, developed and broken down,
a dough’s resistance to mixing is measured and recorded by the
Farinograph. This resistance is called consistency. The water absorp-
tion is the amount of water required for a dough to reach a definite
consistency (500 Brabender units) and is expressed as a percentage
of the flour mass, reported on a 14% moisture basis.
This season’s average water absorption was 59,5% compared to the
60,1% of the previous season. The Free State area had the highest
water absorption of the three production areas, albeit only slightly.
The development time is the time from the beginning of water
addition until the dough reaches its optimum consistency. A long
development time can be associated with flours with a high percent-
age of gluten-forming proteins.
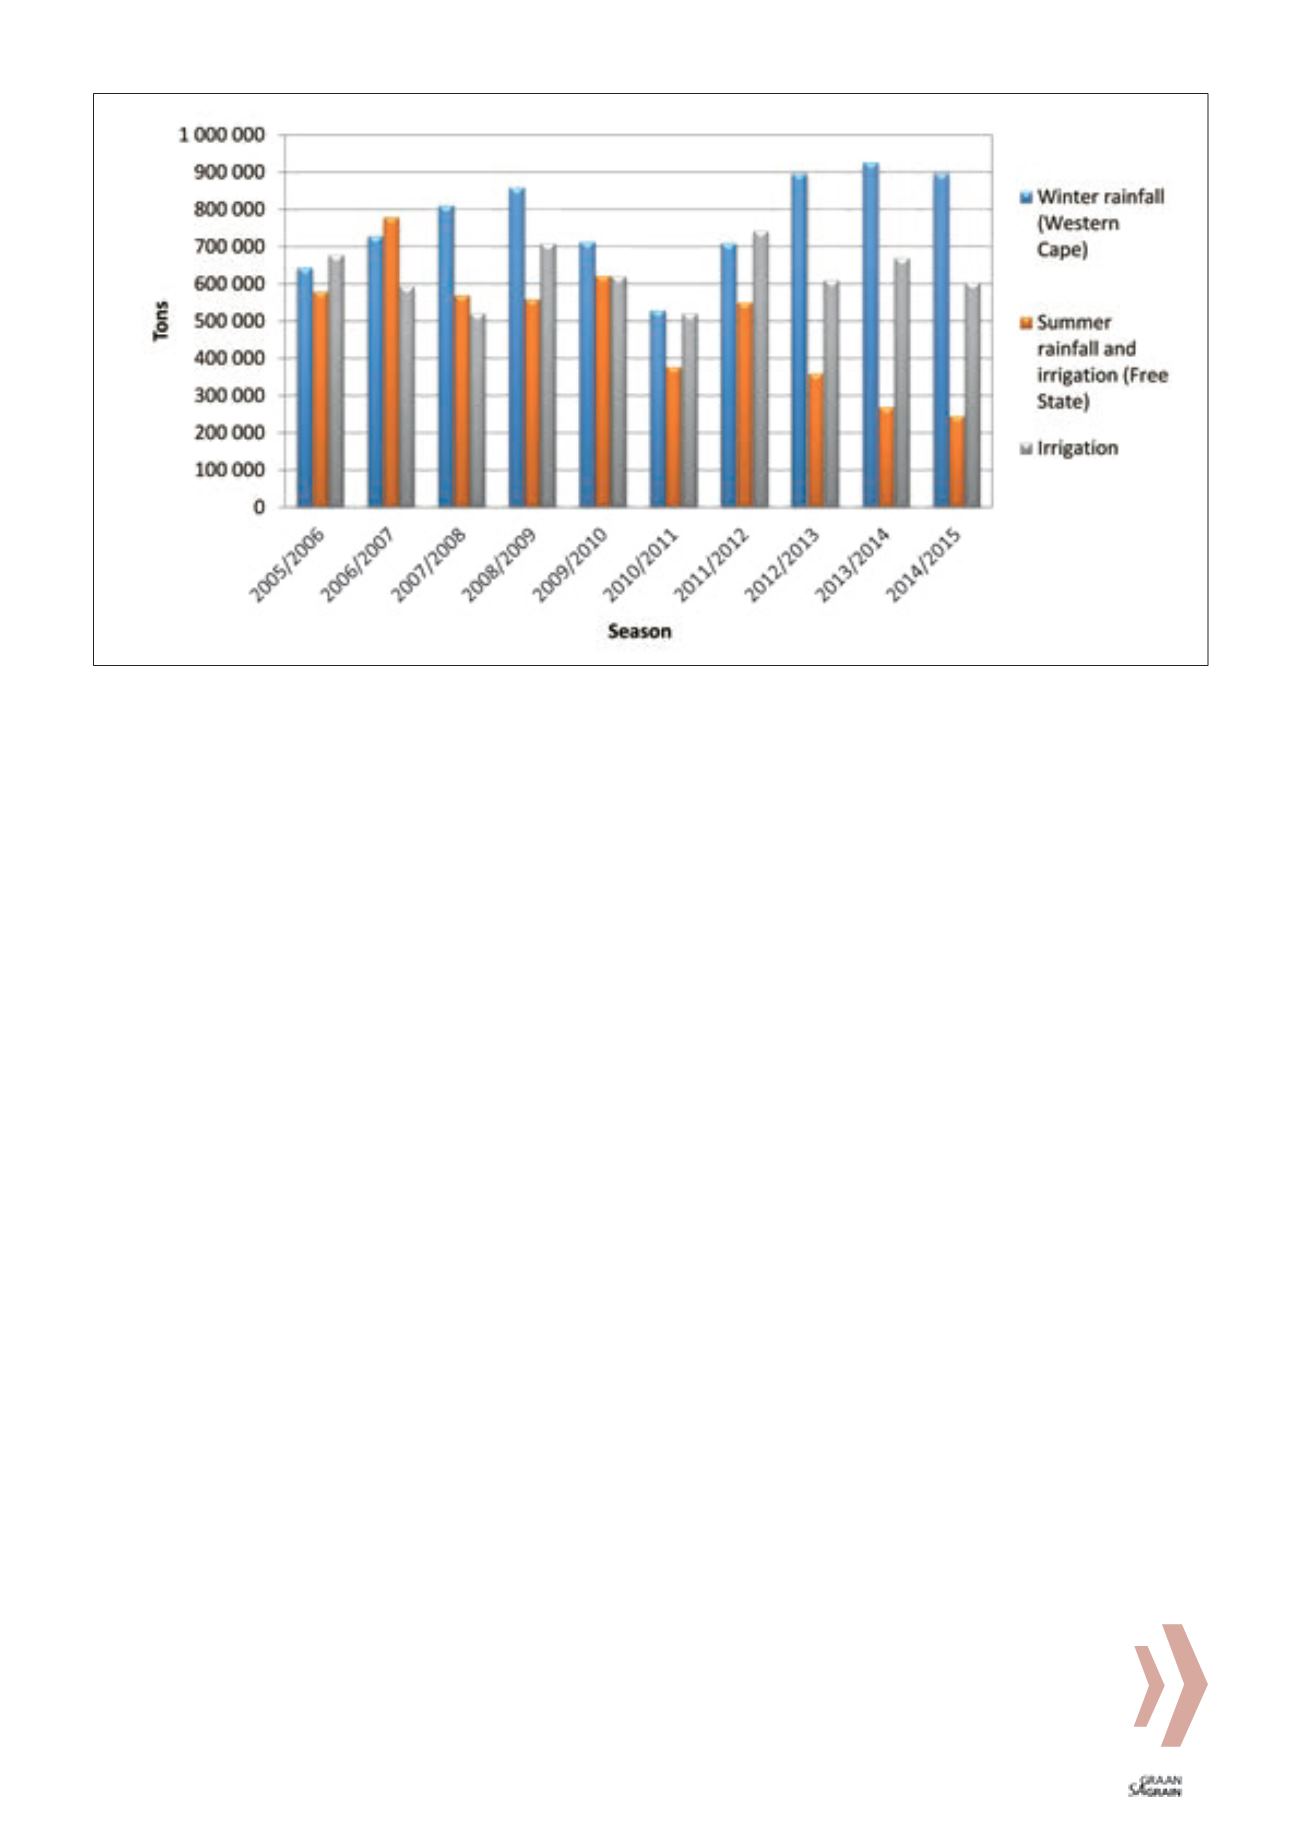
Graph 1: Wheat production figures per production area over ten seasons.
Figures obtained from the Crop Estimates Committee