Augustus 2014


            88


          SouthAfricanmaizemarket structure
        
        
          andEast Africanexport opportunities
        
        
          under the spotlight
        
        
          S
        
        
          outh Africa’s 2014/2015maize export pace have been slow
        
        
          relative to last year’s pace; on 18 June 2014 total exports
        
        
          were 60% behind last year (at 139 313 tons, compared to
        
        
          345 019 tons in 2013/2014).
        
        
          There are a number of factors resulting in this slow pace, but one
        
        
          notably being the soft demand in traditional South African export
        
        
          markets. Thus, this article aims to view the South African export
        
        
          market structures, as well as the possible export opportunities in
        
        
          East Africa.
        
        
          Maizemarket structure
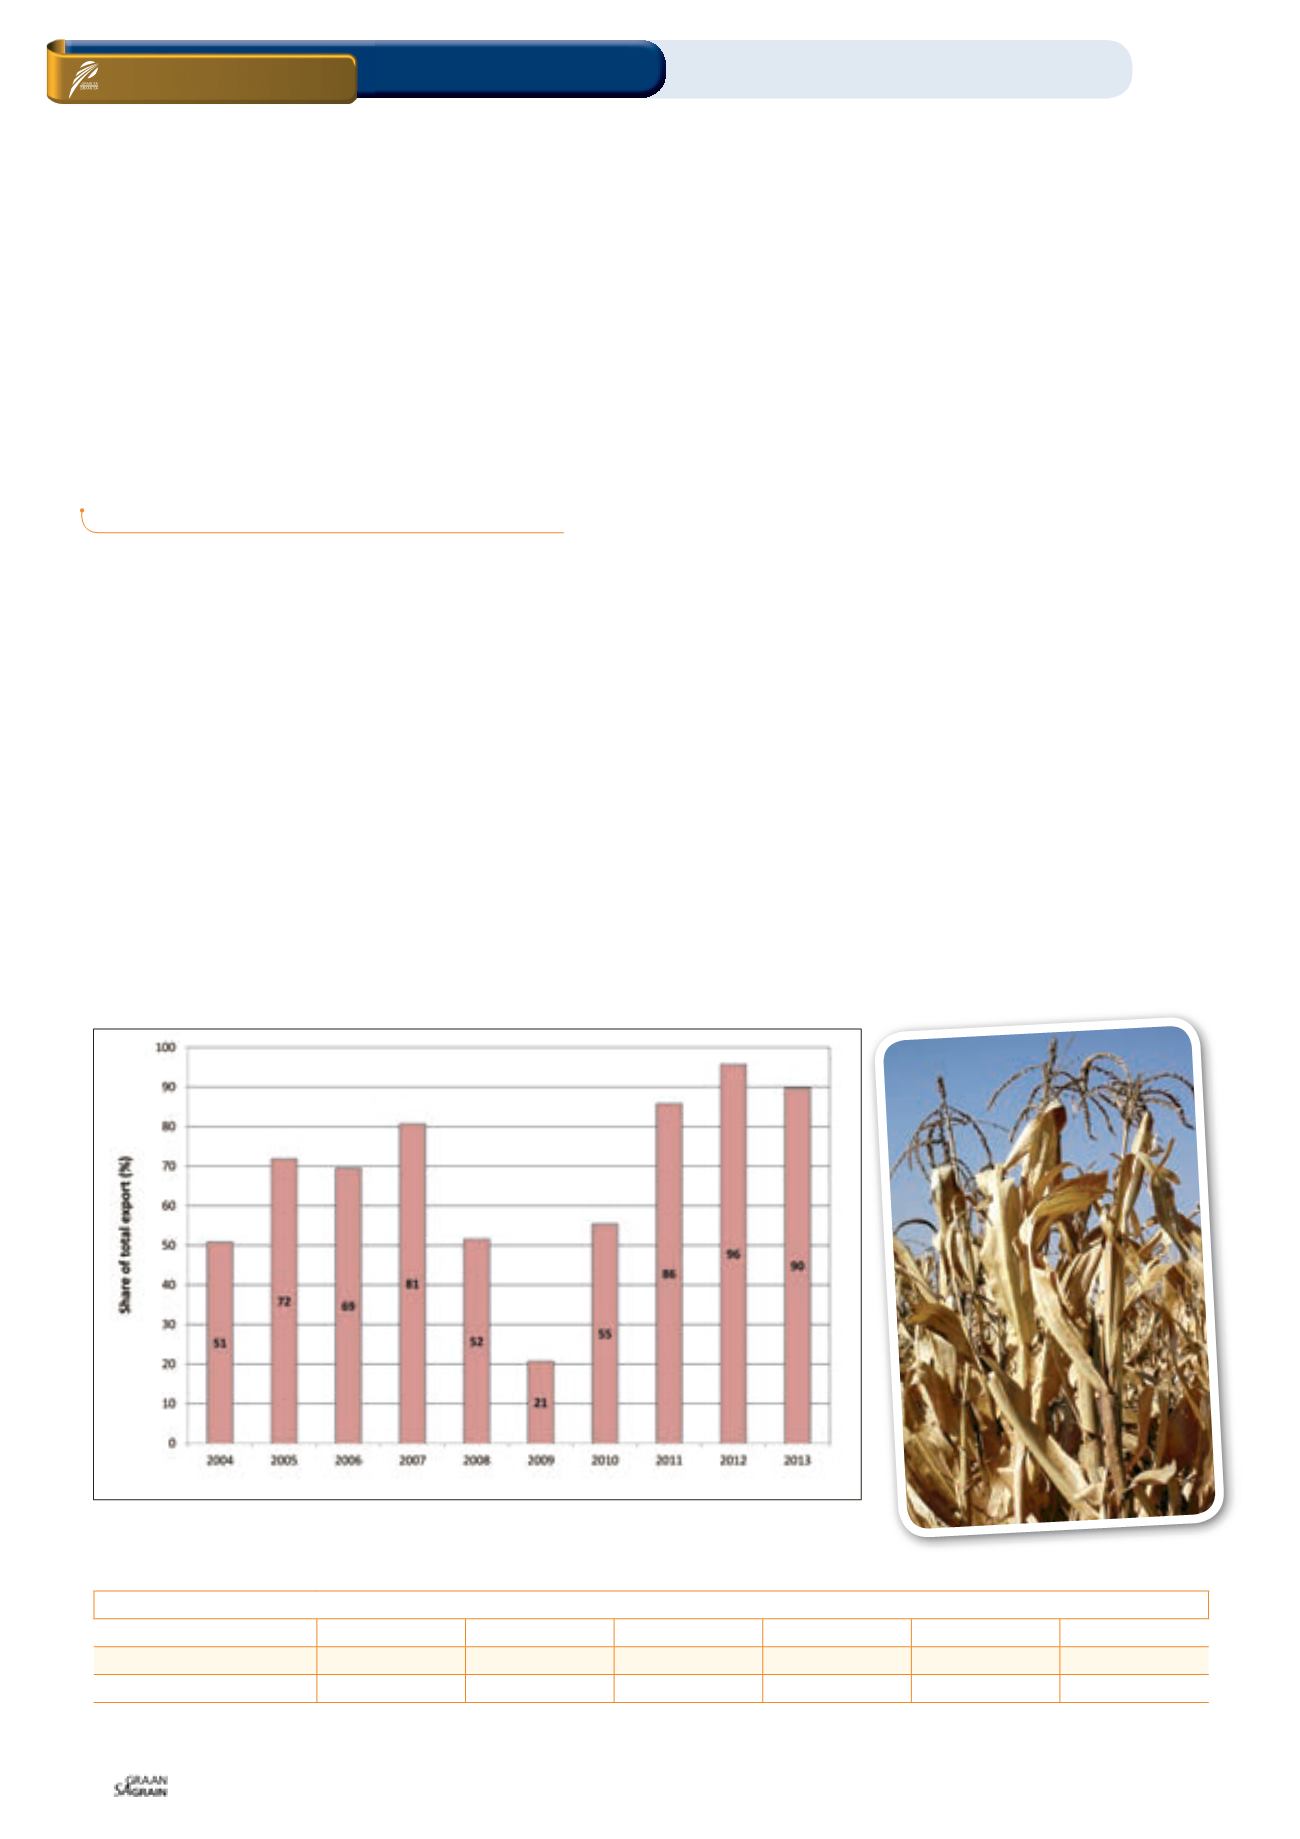


            Graph 1


          shows that in the past three years, South African maize
        
        
          exports becomemore concentrated; meaning that a large quantity
        
        
          of South African maize have been increasingly going to a few
        
        
          countries. However, this was not the case ten years ago; evidently
        
        
          in 2004 the top tenSouthAfrican importing countries accounted for
        
        
          approximately 51%of the total exports (ITC, 2014).
        
        
          This means that South African maize export markets were wide,
        
        
          hence a positive view for market development and/or expansion.
        
        
          Over the years this trend continued at a volatile pace; with 2007
        
        
          data showing that the top ten South African importing countries
        
        
          accounted for approximately81%of the total exportedquantity, and
        
        
          sobecomingmore concentrated (ITC, 2014).
        
        
          In 2009, South African maize exports were wide, only 21% of the
        
        
          total maize went to the top ten importing countries. However, the
        
        
          past three years’ data shows that maize export markets became
        
        
          highly concentrated; with the 2011, 2012 and 2013 top ten importing
        
        
          countries accounting for 86%, 96% and 90%, respectively (Graph 1).
        
        
          This trendbasicallyshows that agreaterpercentageofSouthAfrican
        
        
          exportswent to few countries (markets became concentration).
        
        
          Highmarket concentration tends to increase the level of dependency
        
        
          to few importers. Evidently, the current crop (2014/2015 maize) is
        
        
          showing a slow export pace, owing to slow demand from the few


            ON FARM LEVEL


              Maizemarket / Export opportunities / East Africa


          Markets
        
        
          WANDILE SIHLOBO,
        
        
          economist, Industry Services, Grain SA


            KENYA


            2013


            2014


            e


            2015


            f


            2016


            f


            2017


            f


            2017


            f


          Production
        
        
          3,6
        
        
          2,9
        
        
          3,0
        
        
          3,2
        
        
          3,4
        
        
          3,5
        
        
          Consumption
        
        
          3,8
        
        
          3,8
        
        
          3,9
        
        
          4,0
        
        
          4,1
        
        
          4,2
        
        
          Estimated imports*
        
        
          0,2
        
        
          0,9
        
        
          0,9
        
        
          1,0
        
        
          0,7
        
        
          0,7


            TABLE 1: KENYAMAIZEPRODUCTION, CONSUMPTIONAND ESTIMATED IMPORTS (MILLION TONS).


            e= estimate; f= forecast; estimated imports*=own calculations


          Source: BMI (2014)


            Graph 1: Trends in the concentrationof SouthAfrica’smarkets structure (top ten importing countries).


            SAGrain/


          Sasol Nitrophoto competition