


 4 / 73

THE
GRAIN AND OILSEED INDUSTRY
OF SOUTH AFRICA – A JOURNEY THROUGH TIME
ႆ
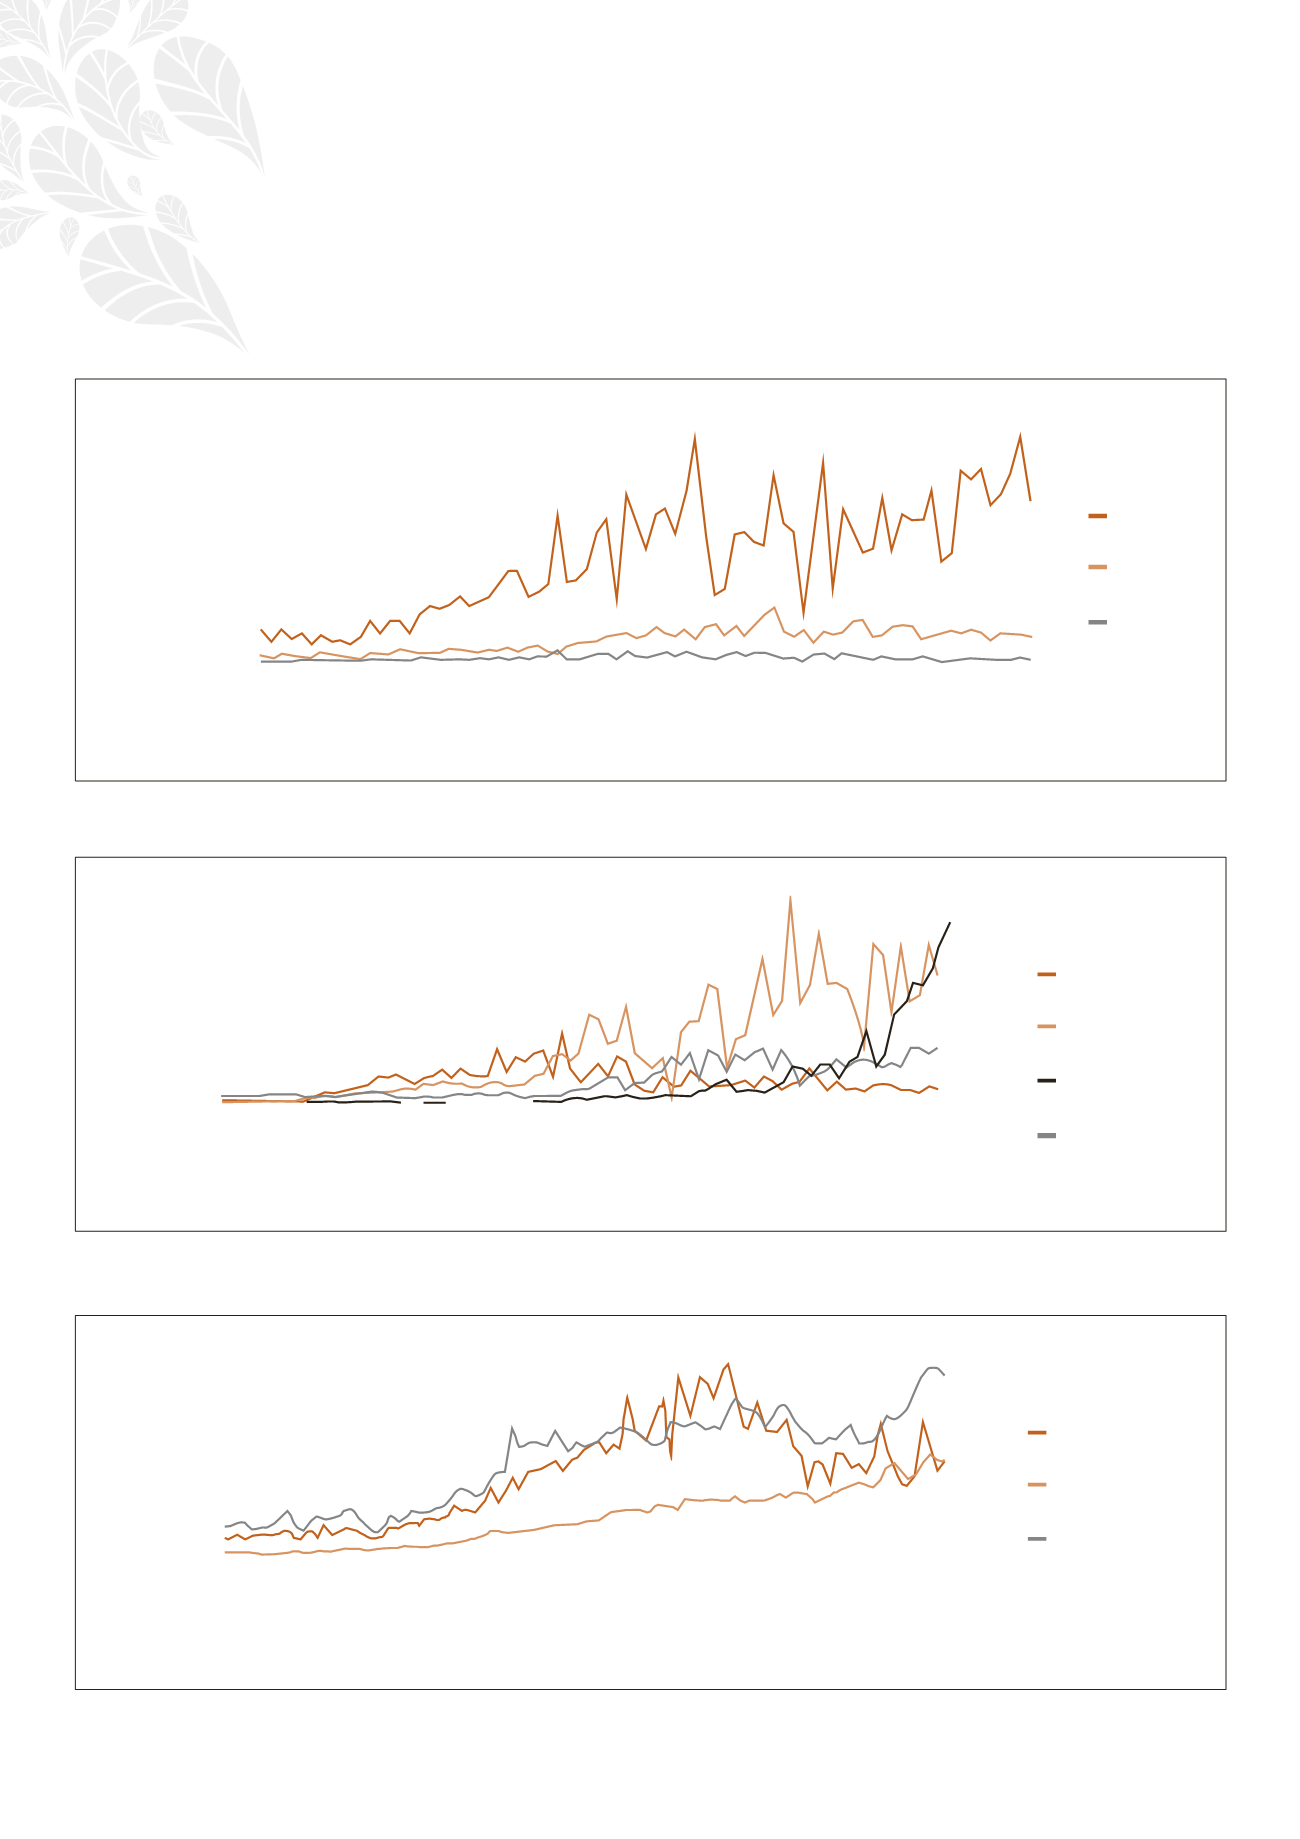
The relative contribution that each of the products made in terms of volume pro-
duced is clear from Graphs 2 and 3.
The area on which maize is cultivated has traditionally varied considerably be-
cause maize is mainly cultivated on dryland. This area has decreased significant-
ly since the drought of the middle 1990s. Statistics show that the area cultivated
under maize decreased by roughly 40% over just more than three decades (from
1980 to 2013) – from about five million hectares to about three million hectares.
16 000 000
14 000 000
12 000 000
10 000 000
8 000 000
6 000 000
4 000 000
2 000 000
0
Tons produced
1936/1937
1939/1940
1942/1943
1945/1946
1948/1949
1951/1952
1954/1955
1957/1958
1960/1961
1963/1964
1966/1967
1969/1970
1972/1973
1975/1976
1978/1979
1981/1982
1984/1985
1987/1988
1990/1991
1993/1994
1996/1997
1999/2000
2002/2003
2005/2006
2008/2009
2011/2012
2014/2015
Graph 2: Grain production – volumes (maize, wheat, sorghum)
Maize
Sorghum
Wheat
1 200 000
1 000 000
800 000
600 000
400 000
200 000
0
Tons produced
1936/1937
1939/1940
1942/1943
1945/1946
1948/1949
1951/1952
1954/1955
1957/1958
1960/1961
1963/1964
1966/1967
1969/1970
1972/1973
1975/1976
1978/1979
1981/1982
1984/1985
1987/1988
1990/1991
1993/1994
1996/1997
1999/2000
2002/2003
2005/2006
2008/2009
2011/2012
2014/2015
Groundnuts
Soybeans
Sunflower
Barley
Graph 3: Grain production – volumes (groundnuts, sunflower, soybeans, barley)
50 000
45 000
40 000
35 000
30 000
25 000
20 000
15 000
10 000
5 000
0
R million
1910/1911
1920/1921
1930/1931
1940/1941
1950/1951
1960/1961
1970/1971
1980/1981
1990/1991
2000/2001
2010/2011
Crops
Livestock
Orchards and other
Graph 4: Gross value of agricultural production – historical