- Follow us:
- Our Commodities:
-
December 2017
The deep root system of a sunflower enables the plant to perform better than other crops during dry seasons, making sunflower seed production very suitable for South African climatic conditions. As a result, sunflower seed production for the 2015/2016 production season exceeded soybean production for the first time since the 2010/2011 season.
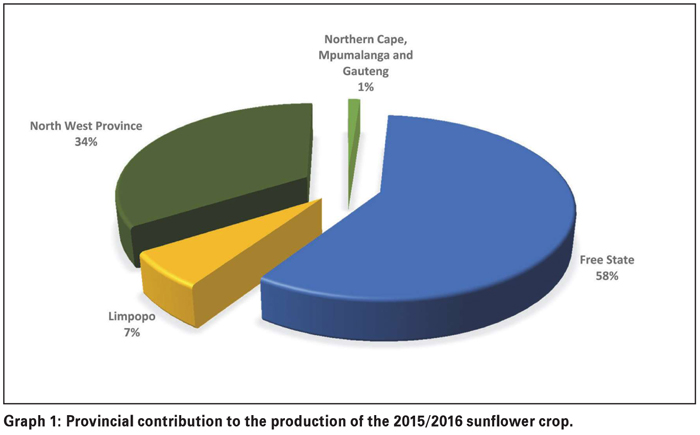
2015/2016 season’s final commercial sunflower crop figure is 755 000 tons. This figure represents an increase of almost 14% (92 000 tons) compared to the 2014/2015 season. The major sunflower-producing provinces, namely the Free State and North West Province, contributed 92% of the total crop (Graph 1).
The area utilised for sunflower production increased by almost 25%, from 576 000 ha in the previous season, to 718 500 ha this season. Due to the drought conditions, production only increased by 14% as the yield decreased from 1,15 t/ha to 1,05 t/ha.
World sunflower seed production for the 2015/2016 season stands at 42 465 million tons with the Ukraine and Russia contributing 51% to this total. The forecast for the 2016/2017 season was 47 397 million tons, according to figures published in the 2016 US Sunflower Crop Quality Report, compiled by the National Sunflower Association.
According to The Bureau for Food and Agricultural Policy (BFAP) Baseline, Agricultural Outlook 2016 to 2025, sunflower area is expected to decline in 2017 to around 2015 levels, assuming normal rainfall patterns, before stabilising at around 560 000 ha by 2025. An average production increase of 1,4% per year is expected to result in a production of 820 000 tons by 2025, driven by average annual improvements in yield of close to 3% also by 2025.
During the 2016 harvesting season, a representative sample of each delivery of sunflower at the various silos was taken according to the prescribed grading regulations. 176 composite sunflower samples, representing the different production regions, were analysed for quality and the results published in the fourth annual sunflower crop quality survey report.
Summary of the quality results
78% (138) of the 176 samples analysed for the purpose of this survey was graded as Grade FH1 and 38 of the samples were downgraded to class other sunflower seed (COSF). The percentage of FH1 samples showed a decrease compared to the 86% and 82% of the 2014/2015 and 2013/2014 seasons respectively. This decreasing trend could not be attributed to any single grading deviation.
The majority of samples was downgraded as a result of the percentage of either the screenings or foreign matter or the collective deviations or a combination of these exceeding the maximum permissible deviations of 4%, 4% and 6% respectively. The presence of poisonous seeds (Datura sp.) exceeding the maximum permissible number, namely 1 per 1 000 g, was also a contributing factor.
Gauteng, represented by two samples, reported the highest weighted average percentage screenings namely 3,6%, followed by North West Province (N = 80) and the Free State (N = 80) with 2,8% and 2,01% respectively. Limpopo (seven samples) reported the lowest average percentage screenings of 1,09%. The weighted national average was 2,34% compared to the 2,05% of the previous season. The maximum permissible deviation according to the grading regulations is 4%.
Sclerotia of Sclerotinia sclerotiorum were observed on 18 of the samples (10%), compared to the nine and eleven of the previous two seasons respectively. 14 of these samples originated in the North West Province and three in the Free State.
The highest percentage (1,8%) was present on a sample from Mpumalanga. This is, however, still well below the maximum allowable level of 4%. Weighted average levels ranged from 0% for the Gauteng and Limpopo provinces, 0,03% in the Free State, 0,04% in the North West Province to 0,26% in Mpumalanga. The national average of 0,04% was equal to the previous season.
The highest weighted percentage foreign matter (1,77%) was reported for the seven samples from Mpumalanga. The Free State and North West Province averaged 1,61% and 1,23% respectively. The lowest average percentage was found in Limpopo, namely 1,01%. The South African average of 1,41% was the highest of the last three seasons.
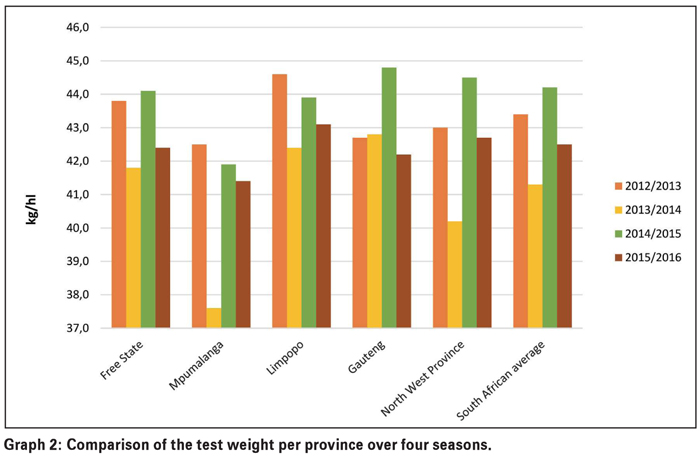
Test weight, providing a measure of the bulk density of grain and oilseeds, does not form part of the grading regulations for sunflower seeds in South Africa. An approximation of the test weight of these crop samples was done by determining the g/1 litre filling weight of each sample using the Kern 222 apparatus.
The test weight was then extrapolated by means of formulas obtained from the Test Weight Conversion Chart for Sunflower Seed, Oil of the Canadian Grain Commission. The weighted average this season was 42,5 kg/hl. Individual values ranged from 35 kg/hl to 48,1 kg/hl. Last seasons’ values ranged from 34 kg/hl to 50,5 kg/hl and averaged 44,2 kg/hl. See Graph 2.
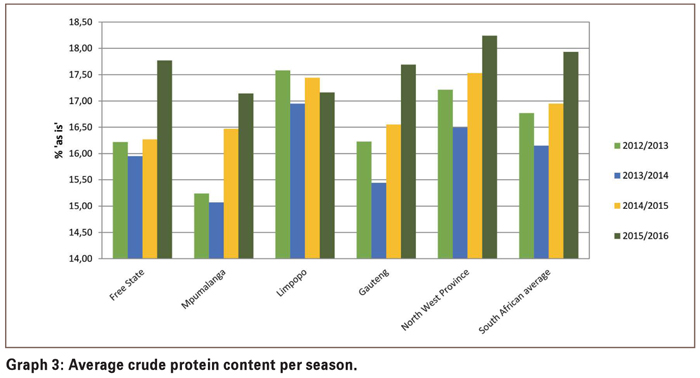
Nutritional component analyses, namely crude protein, -fat, -fibre and ash are reported as percentage (g/100 g) on an ‘as received’ or ‘as is’ basis. The weighted average crude protein content this season was 17,93%, almost 1% higher than the previous season and the highest average value since the start of this survey in 2012/2013. North West Province had the highest weighted average crude protein content of 18,24% and Mpumalanga the lowest with 17,14%. The Free State’s crude protein content averaged 17,77%. Refer to Graph 3.
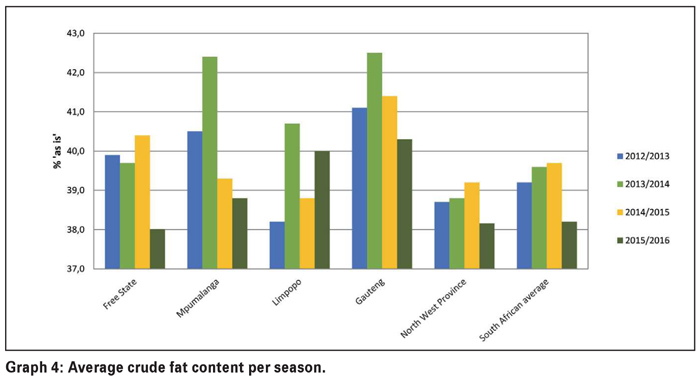
The weighted average crude fat percentage of 38,2% was the lowest of the last four seasons and 1,5% lower than the previous season. Gauteng had the highest weighted average crude fat content of 40,3%. The lowest average fat content was observed in the Free State (38%). North West Province and Mpumalanga averaged 38,2% and 38,8% respectively. See Graph 4.
Weighted average percentage crude fibre increased slightly from 20% in the previous season to 20,3% this season. Average values varied between 19,2% in Gauteng to 20,9% in Mpumalanga. The weighted average ash content is slightly higher (2,59%) than last season (2,55%). The provincial averages ranged from 2,49% in Mpumalanga to 2,69% in Limpopo.
The results of this survey are available on the SAGL website (www.sagl.co.za). The hard copy reports are distributed to all the directly affected groups and interested parties. The report is also available for download in a PDF format from the website.

Publication: December 2017
Section: Relevant
