- Follow us:
- Our Commodities:
-
October 2017
A Water Research Commission (WRC)-funded project team, using a novel approach to estimate the total area and water use associated with irrigated agriculture in South Africa, is seeking feedback on the initial findings.
According to the National Development Plan published by government in 2012, agriculture has the potential to create close to a million new jobs by 2030, but one of the actions needed to achieve this is to expand irrigated agriculture.
‘Evidence shows that the 1,5 million ha under irrigation (which produce virtually all South Africa's horticultural harvest and some field crops) can be expanded by at least 500 000 ha through the better use of existing water resources and developing new water schemes,’ the document states.
During the intervening five years, these sentiments have been called into question by various role-players from government, academia and agribusinesses. Although most agree that irrigation efficiency can – and should – be greatly improved, they view the proposed expansion as overly ambitious, particularly since water shortages already being experienced in so many catchments may worsen with climate change. Practically achievable targets for expansion of irrigation at provincial level are detailed in the Irrigation Strategy for South Africa, published by the Department of Agriculture, Forestry and Fisheries (DAFF) in 2015.
There is also uncertainty over the accuracy of the quoted 1,5 million ha under irrigation, because estimates vary by a couple of hundred thousand hectares on either side of this figure and the area actually irrigated, changes slightly from year to year. The National Water Act requires registration of irrigation water use on the Water Authorisation and Registration Management System (WARMS) database, capturing the ‘who, where, why and how much’ details. This information has been analysed and results published for 2008 and 2014 (see the South African Irrigation Institute presentation at the SANCID 2014 Symposium on www.sancid.org.za ), but it is acknowledged that more detailed analysis and verification of the WARMS database is required.
Now a WRC project is using an ‘eye in the sky’ approach to develop a methodology that would allow the area under irrigated agriculture to be mapped on a regular basis, while also estimating the volume of water used. Entitled ‘Wide-scale modelling of water use and water availability with earth observation/satellite imagery’, the project (no. K5/2401, with a summary published in the WRC Knowledge Review for 2014/2015) is jointly funded by the WRC and DAFF and is being conducted by a collaborative team under the leadership of Prof Adriaan van Niekerk of Stellenbosch University.
Essentially, water consumption by crops can be determined by estimating actual evapotranspiration (ET) from remote-sensing data, processed with complex algorithms. This is not the first time the approach has been used in South Africa. A previous WRC project by Jarmain et al. (2014, WRC Report No. TT 602/14) used satellite imagery and the Surface Energy Balance Algorithm for Land (SEBAL) model to estimate actual evapotranspiration, as well as biomass production, crop yield and water use efficiency, for maize and sugarcane in selected growing areas in the Northern Cape and Mpumalanga respectively. That research, which included extensive field measurements and comparison with other models, demonstrated the accuracy of the SEBAL model and the benefits of a remote-sensing approach.
In 2009, however, the developers of SEBAL in The Netherlands had released ETLook, a more advanced model, and it was decided that this should be used to produce actual evapotranspiration data for the entire country and to update information on the area under irrigation.
‘Because we’re looking at the whole of South Africa, with its big climatic gradients, the ETLook model is more suitable than SEBAL, which was developed for a smaller area with more homogeneous climate,’ says Dr Caren Jarmain, a key member of the project team. ‘ETLook also splits the evapotranspiration into evaporation and transpiration, which we could not do with SEBAL.’
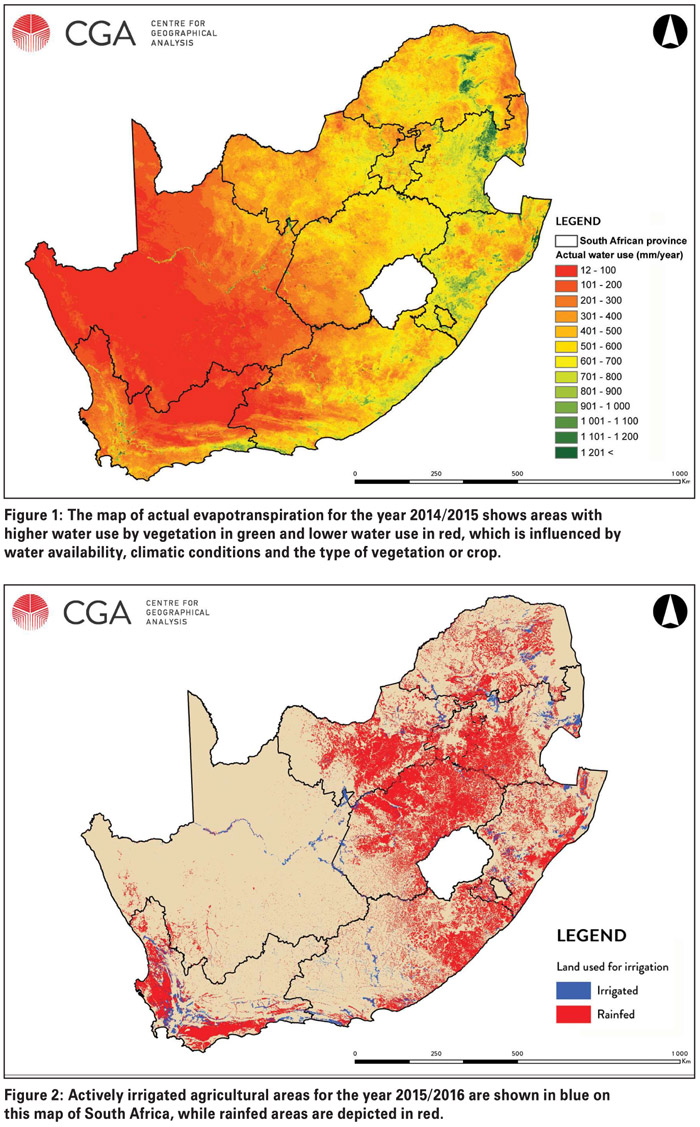
The period 1 August 2014 to 31 July 2015 was chosen for the project, with satellite, land cover and meteorological data fed into the model to produce daily outputs that were combined to generate twelve monthly actual evapotranspiration maps. These monthly maps were in turn aggregated into an annual actual evapotranspiration map, which represents a ‘snapshot’ for that year of the water use by vegetation, expressed in mm/year, over the entire country at a resolution of 250 m.
Next, South Africa’s likely irrigated areas were mapped as accurately as possible using remote sensing and other spatial data on land cover and field boundaries. The annual actual evapotranspiration map and an annual rainfall map were then used to create a map showing the difference between water use and rainfall for every 250 m x 250 m pixel. Applying the assumption that irrigation is likely to occur where water use exceeds the rainfall, the first version of the irrigated agricultural map was generated.
‘This seemed to work reasonably well for most areas, but there were a few exceptions, so our approach was further refined,’ explains Dr Jarmain.
A sophisticated machine-learning analysis was performed using additional datasets derived from high-resolution remote sensing and ETLook modelling that took into account the different climatic regions of South Africa, as well as seasonal influences.
The project team is now seeking feedback on this second version of the map, but reminding respondents that the map shows actively irrigated agricultural areas for the year 2014/2015 rather than the current situation. Landowners and water managers can visit the web portal http://sungis10.sun.ac.za/fields_wrc/ to zoom into their area of interest and check whether particular fields are correctly labelled as either irrigated or rain-fed. They can also identify areas under shade-net, enter any other comments, and select the relevant crop type.
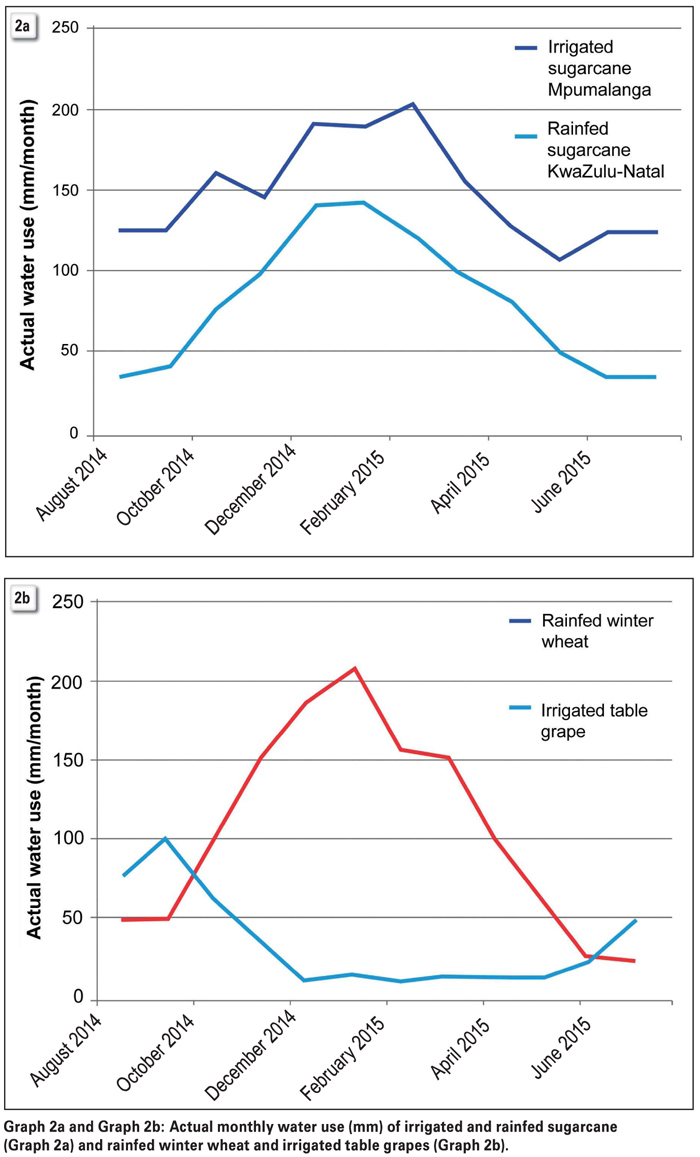
Providing information on crop type would allow the project team to estimate the water consumed by specific crops. They have already done this in certain areas where such data is available, which has allowed for some interesting comparisons. For example, a plot of the monthly water use of a field of irrigated table grapes against one with rain-fed wheat in the Western Cape shows that the wheat used slightly more water than the grape crop during the wet winter months and peaked in September, but the grapes consumed significantly more water in summer. Another example illustrating the difference between irrigated and rain-fed fields of the same crop type shows that irrigated sugarcane in Mpumalanga used considerably more water than rain-fed sugarcane in KwaZulu-Natal throughout the year.
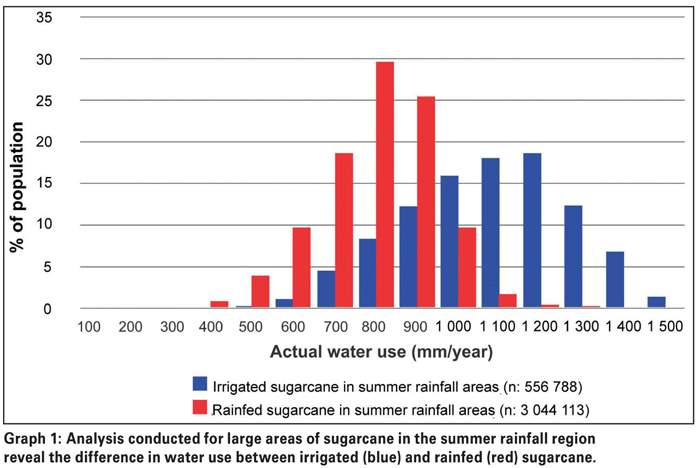
While these two examples compared individual fields, water use information can also be extracted for multiple fields of a crop type to glean an understanding of the variation in water use due to differences in water availability, efficiency of water use, cultivation, irrigation systems, cultivars, soils and other factors.
Again considering sugarcane, which is commercially grown in the summer rainfall region, analyses of large areas showed that most of the population in rain-fed fields had an annual water consumption of between 700 mm and 900 mm, while the bulk of the population in irrigated fields used 1 000 mm to 1 200 mm. In the winter rainfall region, irrigated apples were found to have used more water during the year than irrigated citrus.
The project team would like to do more of such analyses, in light of the fact that many new cultivars and crops have been introduced to South Africa over the past 20 years and little is known about their water use and crop water requirements.
‘Our methodology allows us to tell whether or not a field is irrigated and we can do a water use estimate even if we don’t know what the crop type is – that’s the beauty of a remote-sensing model like ETLook,’ explains Dr Jarmain. ‘But knowing what the crops are would certainly add more value.’
The challenge, however, is to find reliable information on crop distribution.
‘Some sectors, like the sugar industry, have detailed maps, but others only have an approximate figure for how many thousand hectares of a crop are grown in different areas,’ she explains. ‘We’ve received the most information from the Western Cape, because the provincial Department of Agriculture has been funding aerial surveys where field boundaries have been digitised and crops allocated to them.’
Earlier this year, the department advertised a tender to update the data collected in the previous surveys, which mapped and georeferenced all agricultural commodity production and related infrastructure. A summer and winter ‘flyover’ survey will be conducted at an altitude low enough to distinguish the various types of summer and winter crops, with vehicle-based surveys undertaken where this is not possible.
Obtaining up-to-date information is beneficial, because producers sometimes change the crops planted according to market forces or climatic conditions. Dr Jarmain notes, for example, that some ‘wine producers’ in the Western Cape have reverted to growing apples, plums or citrus as they were struggling to make ends meet. Indeed, wine organisation VinPro reports that the average return on investment fell below 1% in 2016, with some 40% of the 3 300 producers making a loss. The value of the rand, competition on the international market and price fluctuations due to supply and demand, are just some of the factors influencing the profitability of any exported product.
In the case of climatic conditions, the drought that began in the northern parts of the country in 2013 intensified over the next two years and by the end of 2015 five provinces – North West Province, KwaZulu-Natal, Free State, Limpopo and Mpumalanga – had declared disaster status. According to the Bureau for Food and Agricultural Policy (BFAP), many producers switched from soybeans, which declined by more than 180 000 ha from 2015 to 2016, to sunflower. The crop is known to be more resilient in drought conditions and has an extended planting window in the western parts of the summer rainfall region, so the area under cultivation expanded by more than 140 000 ha.
Of course, droughts affect crop yields too. In 2015 the country’s total maize harvest was 30% less than the previous year, even though the area planted had only decreased by 1,3%. According to the South African Weather Service, 2015 was the driest year on the national rainfall record, which dates back to 1904. Given that rainfall and biomass production are such key parameters in the ETLook model, is there a concern that the 2014 to 2015 reference year selected for the project might not be representative of the current or longer term situation?
‘Our main expected outcome is to develop the methodology and choosing a reference year was basically just to test it,’ says Dr Jarmain. ‘There will always be years that are drier or wetter in different areas, but the idea is to repeat the process regularly and over time you’d get a better sense of what is happening in an area. Automating the process would allow the information to be updated and made available in near real time. Ideally, a web portal could be set up, where maps could be viewed of crop water use on a monthly basis. The 2014 to 2015 map will be used as a baseline for comparative purposes.’
This would not only facilitate better monitoring of water use, but would also assist managers in taking decisions on possible expansions in irrigated agriculture. One of the project’s aims is to show how the methodology can be combined with a water accounting framework to assess the water available at different scales.
‘For an individual catchment, if we know how much water we have from rainfall and how much is used for irrigation, plus we know of other water extractions taking place and we know what the environmental requirements are, we can get some idea of whether this is a vulnerable catchment,’ says Dr Jarmain.
‘If it’s on the negative side of the balance sheet and there’s clearly no water, the managers could start looking at how the water has been allocated, and it should be a no-go sign for any new developments. But if it’s on the positive side, it would indicate that there is at least a chance for new allocations, requiring more detailed investigation.
’The project is managed by Dr Gerhard Backeberg (executive manager: Water Utilisation in Agriculture, WRC) who reiterates that the main purpose of the research is to establish the baseline of the area irrigated and actual evapotranspiration crop water use with application of satellite imagery.
‘The project is due for completion in March 2018 and the report published by the middle of next year,’ he says. ‘The information generated with this modelling approach should in future be operationally implemented and updated on preferably a monthly basis. Refinement with additional research and development is also required.’
This includes, for example, comparing the area irrigated with suitability of soils for irrigation, investigating water application in relation to actual evapotranspiration crop water requirements, analysing irrigation type (permanent, supplementary or occasional) and methods (surface, sprinkler or micro/drip), evaluating the lawfulness of water use and assessing the scale of irrigation schemes.
The Wide-Scale Modelling of Water Use and Water Availability with Earth Observation/Satellite Imagery project is being
carried out by Stellenbosch University, in partnership with eLEAF®, Agricultural Research Council, GeoTerra Image® and independent consultants.
To contact the project team, email Dr Caren Jarmain at cjarmain@gmail.com.
Publication: October 2017
Section: Focus on
