- Follow us:
- Our Commodities:
-
September 2016
JOLANDA NORTJÉ, manager: Laboratory, The Southern African Grain Laboratory NPC
The impact of the drought conditions experienced over large parts of the maize production regions, was observed not only with regards to a significant reduction in crop size (lowest since the 2006/2007 season) and reduced yields, but also with a lowering of the average 100 kernel mass and smaller kernel sizes.
Equal to that of the 2006/2007 season, the average protein content of 9,4%, is also the highest of the past 16 seasons. The ongoing effect on the 2015/2016 maize crop remains to be seen.
Grading results
2015/2015‘s maize crop was nevertheless of good quality, with 83% of white and 76% yellow maize, graded as maize grade one. The percentage total defective kernels above and below the 6,35 mm sieve, 5,3% for white and 5,8% for yellow maize was respectively 1% and 0,3% lower than the previous season.
Compared to 2013/2014, the percentage defective kernels above the sieve decreased, but the percentage defective kernels below the sieve increased. The percentages Diplodia as well as Fusarium infected kernels were 0,3% and 0,6% lower than the previous season’s 1% and 1,5% respectively.
Foreign matter (0,1%) and other colour maize (0,3%) did not pose significant problems, with only two white and one yellow maize sample downgraded to class other due to foreign matter and eight yellow maize samples downgraded as a result of other colour maize exceeding 5%.
Compared to the 6,8% of the 2013/2014 season, the average percentage combined deviations of white maize was 5,8%. That of yellow maize was also slightly lower – 6,2% compared to 6,4%.
Of the 1 000 maize samples graded according to USA grading regulations, 64% were graded US1, 23% US2, 6% US3, US4 and US5 both 2%, while sample and mixed grades represented 1% and 2% respectively.
The percentage samples graded as US1 was significantly higher than the 42% of the previous season, but lower than the 79% of the 2012/2013 season. The percentage samples graded as US2 was also lower than the 31% of the previous season. The main reason for downgrading the samples were the percentage total damaged kernels exceeding the maximum limit per grade followed by broken corn and foreign material.
Physical quality results
Bushel weight/test weight is applied as a grading factor in the USA grading regulations, but also routinely done at most intake points locally. The specific mass (or grain density) of maize expressed as hectolitre mass in South Africa is influenced by amongst others, factors like cultivar, moisture content, foreign matter, other grain and damaged kernels, for example insect damaged and immature kernels.
White maize had an average test weight of 78,3 kg/hl compared to the 76,3 kg/hl of yellow maize. The test weight in total varied from 67,3 kg/hl to 83,1 kg/hl and averaged 77,3 kg/hl, slightly higher than the ten year average.
Only 29 samples reported values below the minimum requirement (56,0 lbs or 72,1 kg/hl) for USA grade 1 maize – 22 of these samples were from Mpumalanga, four from the North West Province, two from Gauteng and one from the Free State.
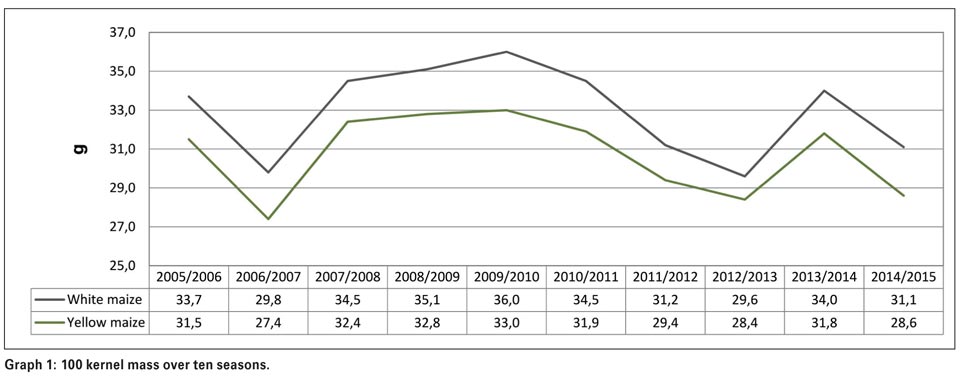
The weight in grams of one hundred whole maize kernels is expressed as the 100 kernel mass and provides a measure of grain size and density. The 100 kernel mass averaged 29,8 g which is 3,1 g lower than the previous season and also 2 g lower than the ten year average. As in previous seasons, white maize (31,1 g) averaged higher than yellow maize (28,6 g). See Graph 1.
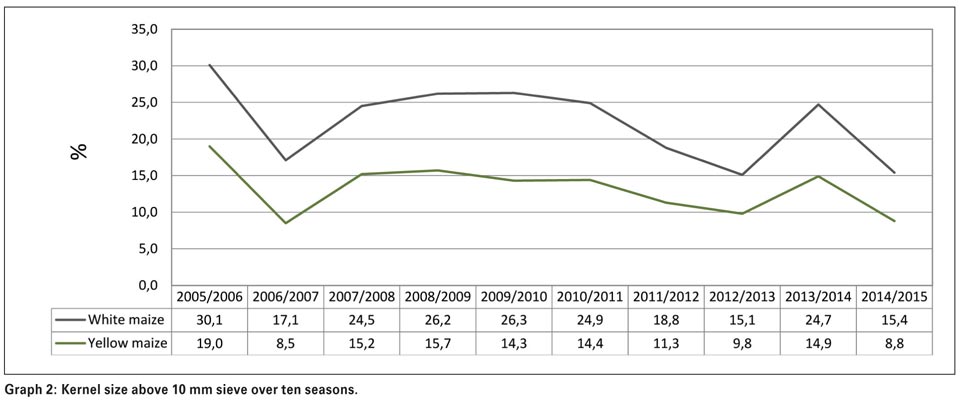
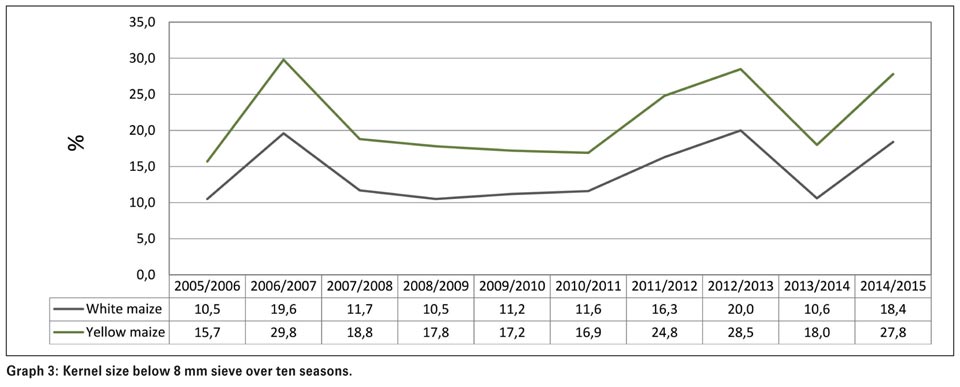
As already mentioned, the effect of the drought can clearly be seen in the kernel sizes of both white and yellow maize that were some of the smallest the past ten seasons – also refer to Graph 2 and Graph 3. The percentage yellow maize kernels above the 10 mm sieve were on average 6,6% lower than white maize kernels and the percentage kernels below the 8 mm sieve – 9,4% higher than that of white maize.
Small kernels can result in losses during the screening stage of processing. Uniform kernel sizes are important for both wet and dry milling processes. Homogenous steeping cannot be achieved with a mixture of small and large kernels. Too small kernels hamper the separation of kernel fractions in the wet milling process and will result in a lower starch yield. Very large kernels are also unfavourable for proper steeping.
Broken kernels are troublesome during various stages of processing. During cleaning before processing, broken kernels are removed together with other impurities, resulting in losses. Broken kernels are further broken during handling, resulting in excessive grain dust being generated, thus creating the potential for dust explosions, health hazards and hygiene problems. Maize containing a high percentage of broken kernels is also more prone to insect infestation and susceptible to mould growth and the production of mycotoxins.
The dampening process prior to dry milling is affected by a high number of broken kernels which may cause lower extraction of products like samp and maize grits. Problems can also be caused with the fibre and fat content of maize products, for example the various grades of maize meal, since the quantity of germ required to be returned to the milled endosperm cannot be determined accurately.
In the wet milling process broken kernels steep more rapidly than whole kernels and by the time the whole kernels have been sufficiently steeped, the broken kernels have been over-steeped, causing an ineffective separation of protein and starch. Both white and yellow maize were less susceptible to breakage than during the previous season, the largest difference (< 6,35 mm) of 0,6% between the two seasons was observed on yellow maize.
Stress cracks are determined by visual inspection of a certain amount of whole maize kernels examined on top of a light box for small internal cracks in the endosperm. Some kernels may even have two or more internal cracks.
Any form of stress may cause internal cracks, for example rapid moisture loss in the field, during harvest or during drying. The percentages stress cracks observed varied from 0% - 61%, averaged 6% and was a percent lower than in the previous season. White maize averaged 6% and yellow maize 5%.
Milling index is an indication of the milling abilities and milling quality of maize kernels where a higher milling index means a higher extraction of the high-grade and most profitable products like samp, maize rice and maize grits (de-germed products).
The milling index is measured with the Infratec 1241 – Grain Analyser. The New Milling Index (NMI) calibration model used for the past two seasons, was developed by the Southern African Grain Laboratory (SAGL) on data acquired from analyses performed on maize cultivar trials over three seasons.
These trials included a range of hardness levels. Samples were supplied by the ARC-Grain Crops Institute (ARC-GCI) and by commercial seed breeders for inclusion in the statistical modelling. The milling index varied from 50,2 to 123,5 and averaged 97,6 – 6,7 higher than the previous season. The average milling index for white maize is higher (100,4) than that of yellow maize (95).
Roff milling and whiteness index (WI)
The Roff 150 series maize mill is used to mill representative samples of 500 g. Every mill has three separations, namely germ, grits and maize meal. Break 1, 2 and 3 meal are weighed for determination of percentage extraction total meal. The average percentage extraction of total meal in white maize obtained averaged 78,7% (0,3% lower than the previous season) and varied from 69% to 84,3%.
For the white maize meal, the whiteness index obtained from Break 2 and 3 of the Roff mill, was determined with the HunterLab ColorFlex 45°/0°. Whiteness index was done on unsifted and sifted maize meal samples. The sifted samples were sieved over a 300 µm sieve and then mixed to contain 87% of maize meal larger than 300 µm and 13% of maize meal smaller than 300 µm. Sieving the sample eliminates differences in the readings as a result of particle size.
Whiteness index averaged 22,9 for unsifted and 14,9 for sifted maize meal. The higher the whiteness index value obtained, the whiter the meal sample. The whiteness index of the previous season averaged 25,3 for unsifted maize meal. Sifted maize meal averaged 15,6. The main contributing factors causing differences in whiteness index values are the presence of other colour maize like yellow maize, the presence of defective kernels, cultivar as well as the soil composition.
Nutritional values
Fat, starch and protein nutritional components are measured with an Infratec 1241 Whole Grain Analyser. The measurements are based on the fact that the constituents to be measured in the whole maize kernels, absorb electromagnetic radiation in the near-infrared region of the spectrum.
Results are reported as a percentage (g/100 g) on a dry (moisture free) base. In general, white maize tends to have a higher fat content than yellow maize, but a lower starch content. No clear trend can be observed with regards to the protein content.
The average fat content of the 2014/2015 crop samples was 4,1% - 0,2% higher than in the previous season as well as the weighted ten year average. The average protein content of 9,4% was the highest since the 2006/2007 season and 0,8% higher than last season. The ten year weighted average is 8,7%. This increase can be attributed to the drought conditions. The starch content this season decreased on average with 0,2% compared to the previous season and is 0,2% higher than the ten year weighted average of 72,6%.
White maize's fat content was 0,2% higher than both the previous season and the average of yellow maize (4%). The protein content of yellow maize was 0,1% higher than that of white maize (9,4%) and almost a percent higher than in 2013/2014, while white maize’s protein content increased 0,8% year on year. The ten year weighted average of both white and yellow maize is 8,7%. The starch contents of white and yellow maize are 0,3% and 0,2% respectively lower than the previous season.
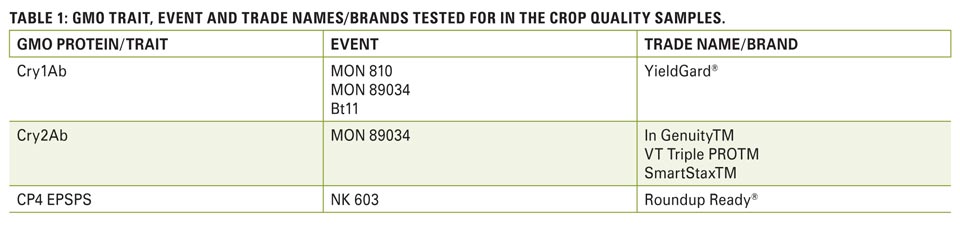
Genetic modification (GM)
SAGL screened 100 of the crop samples to test for the presence of the Cry1Ab, Cry2Ab and/or CP4 EPSPS traits. 94% of the samples tested positive for Cry1Ab, 81% tested positive for the Cry2Ab and 98% for the CP4 EPSPS trait. See Table 1 for a summary of the events and trade names/brands represented by these three traits.
Mycotoxins
Annual maize crop quality surveys provide an ideal opportunity to evaluate the occurrence status of mycotoxins throughout all production regions in South Africa. Reliable analytical data is accumulated to establish a database to enable industry to comment on proposed legislative levels and to supply reliable data for targeted research projects to effectively manage the mycotoxin levels in maize.
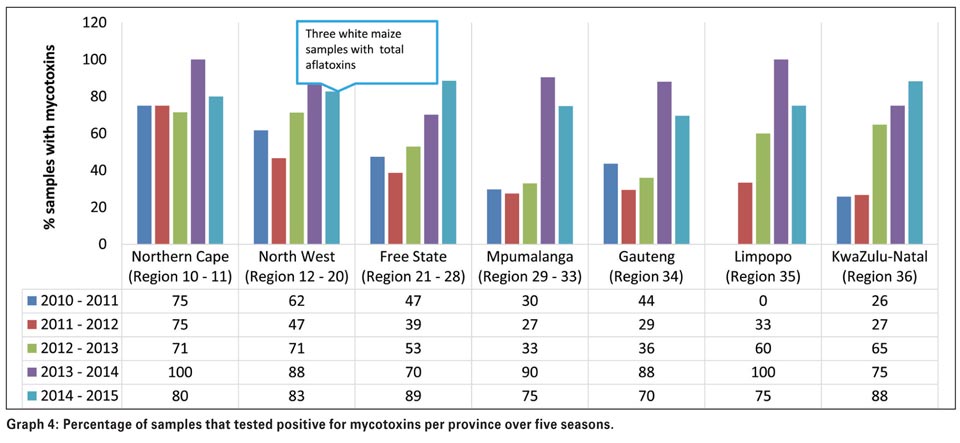
A total number of 325 samples were analysed for mycotoxin residue levels in the 2010/2011 season. From the 2011/2012 season onwards to the 2014/2015 season, 350 samples were analysed annually. The samples were selected to represent all the production regions as well as both white and yellow maize proportionally.
Different patterns of occurrence are observed in different seasons. Mean concentration levels also differ over seasons. For the first time since the 2010/2011 season, three samples tested positive for Aflatoxin residues. All three of these samples were white maize from regions in North West Province. Fumonisin and DON were found in samples from all the maize producing regions, except for Limpopo where no DON was found. Fumonisin tend to show higher mean concentrations on yellow maize compared to white maize from the same region.
On all 350 samples tested, the average Fuminisin level (sum of B1, B2 and B3) was 224 µg/kg (ppb) and ranged from 0 (not detected [ND]) to 3 382 µg/kg. This average is higher than the previous season’s 186 µg/kg. Of the 350 samples tested, 197 samples (56%) tested positive for Fumonisin levels and the average of these positive results was 397 µg/kg. The previous season, 41% of the samples tested positive, with an average of 456 µg/kg.
The highest Deoxynivalenol (DON) level detected was 9 736 µg/kg compared to the 6 134 µg/kg of last season. The average level of all samples tested this season was 183 µg/kg and 289 µg/kg in the previous season. 69% of the samples tested positive for DON last season compared to 41% this season. The average of the positive results increased from 417 µg/kg in 2013/2014 to 447 µg/kg in 2014/2015. DON shows higher mean concentrations on white maize than yellow maize from the same region.
11% of the samples tested positive for 15-Acetyl-Deoxynivalenol (15-ADON) residues. The average of the positive results was 251 µg/ kg compared to 182 µg/kg in the previous season.
Zearalenone residues were found in 11% of the samples also, values ranged from 0 (ND) to 337 µg/kg. The average of the positive samples was 60 µg/kg compared to the 78 µg/kg of the previous season when 12% of the samples tested positive. Zearalenone mean concentrations tend to show better correlation between white and yellow maize from the same region, than Fumonisin and DON.
None of the 350 samples tested positive for Ochratoxin A, HT-2 or T-2 toxin residues. Mycotoxin levels lower than the limit of quantitation (LOQ) as well as limit of detection (LOD) determined for the multi-mycotoxin method and LC-MS/MS instrument, were seen as having tested negative for calculation purposes.
Maize imports and exports during the 2014/2015 marketing season
A total of 65 250 tons of yellow maize was imported from Argentina during the period 26 April 2014 to 24 April 2015.
Twelve samples of this maize were received at the SAGL for quality analyses purposes. Two of the samples were graded YM1, one sample YM2 and nine samples were downgraded to Class Other Maize according to South African grading regulations.
Eight of the nine samples were downgraded due to the presence of an undesirable odour and the last sample as a result of poisonous seeds in excess of the maximum permissible number, namely one per 1 000 g.
Results of the quality analyses performed on the imported maize are compared to those of the local maize crop of the corresponding class and grade and period. The grading results, excluding the presence of the undesirable odour and poisonous seeds, looked good and compared well with that of local maize.
The 100 kernel mass of the imported maize was lower on average and the kernel sizes significantly smaller. The kernels were also less susceptible to breakage. The average protein content of the imported maize compared well with the South African maize, while the average fat content was higher and the starch lower.
Fumonisin, Deoxynivalenol and Zearalenone mycotoxin content was on average higher than locally produced maize. Levels were however still well below internationally acceptable limits as well as national maximum limits for animal feed.
Maize imports and exports during the 2015/2016 marketing season
During the previous marketing season, maize imports for local use were received from 25 April 2015 to 29 April 2016. A total of 102 179 tons of white maize and 1 865 256 tons of yellow maize was imported. Department of Agriculture, Forestry and Fisheries (DAFF) inspectors at the various harbours forwarded vessel hold samples to SAGL for analysis.
These samples consisted of white maize from Mexico (one sample) and the United States (seven samples). Yellow maize was represented by 130 samples from Argentina, 70 from Brazil, 25 from Paraguay and five from the Ukraine.
The majority of the samples that were downgraded to Class Other Maize according to South African grading regulations were due to the presence of an undesirable odour. 13 samples were downgraded as a result of poisonous seeds in excess of the maximum permissible number of either one per 1 000 g or seven per 1 000 g.
One sample was downgraded as a result of the foreign matter present exceeding the allowable level of 0,75%, two samples due to the presence of live insects and two sample as a results of the percentage defective kernels below the 6,35 mm sieve exceeding 9%.
Fumonisin, Deoxynivalenol and Zearalenone mycotoxin content was on average higher than locally produced maize. Levels were, however, still well below internationally acceptable limits as well as national maximum limits for animal feed.
The detailed results of local as well as imported maize are available on the SAGL website (www.sagl.co.za). The annual crop quality reports in PDF format are also available for download from the website.
We would like to express our gratitude to the Maize Trust for financial support of these annual surveys and to the members of Agbiz Grain and DAFF inspectors for providing the crop and imported maize samples respectively.
Publication: September 2016
Section: Relevant
